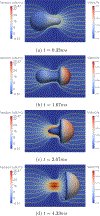
Numerical simulation of cell squeezing through a micropore by the immersed boundary method
- PMID: 31105387
- PMCID: PMC6521979
- DOI: 10.1177/0954406217730850
Numerical simulation of cell squeezing through a micropore by the immersed boundary method
Abstract
The deformability of cells has been used as a biomarker to detect circulating tumor cells (CTCs) from patient blood sample using microfluidic devices with microscale pores. Successful separations of CTCs from a blood sample requires careful design of the micropore size and applied pressure. This paper presented a parametric study of cell squeezing through micropores with different size and pressure. Different membrane compressibility modulus was used to characterize the deformability of varying cancer cells. Nucleus effect was also considered. It shows that the cell translocation time though the micropore increases with cell membrane compressibility modulus and nucleus stiffness. Particularly, it increases exponentially as the micropore diameter or pressure decreases. The simulation results such as the cell squeezing shape and translocation time agree well with experimental observations. The simulation results suggest that special care should be taken in applying Laplace-Young equation (LYE) to microfluidic design due to the nonuniform stress distribution and membrane bending resistance.
Keywords: Cancer Cell Detection; Immersed Boundary Method; Lattice Boltzmann Method; Microfluidics Design.
Figures


Similar articles
-
Numerical simulation of intracellular drug delivery via rapid squeezing.Biomicrofluidics. 2021 Aug 2;15(4):044102. doi: 10.1063/5.0059165. eCollection 2021 Jul. Biomicrofluidics. 2021. PMID: 34367404 Free PMC article.
-
Microscale boundary conditions of the lattice Boltzmann equation method for simulating microtube flows.Phys Rev E Stat Nonlin Soft Matter Phys. 2012 Jul;86(1 Pt 2):016712. doi: 10.1103/PhysRevE.86.016712. Epub 2012 Jul 30. Phys Rev E Stat Nonlin Soft Matter Phys. 2012. PMID: 23005568
-
Multiscale modeling of hemolysis during microfiltration.Microfluid Nanofluidics. 2020 May;24(5):33. doi: 10.1007/s10404-020-02337-3. Epub 2020 Apr 10. Microfluid Nanofluidics. 2020. PMID: 33235552 Free PMC article.
-
Numerical simulations of deformation and aggregation of red blood cells in shear flow.Crit Rev Biomed Eng. 2013;41(4-5):425-34. doi: 10.1615/critrevbiomedeng.2014010689. Crit Rev Biomed Eng. 2013. PMID: 24941417 Review.
-
Detection of Circulating Tumor Cells Using Microfluidics.ACS Comb Sci. 2018 Mar 12;20(3):107-126. doi: 10.1021/acscombsci.7b00146. Epub 2018 Feb 2. ACS Comb Sci. 2018. PMID: 29363937 Review.
Cited by
-
3D Printing metamaterials towards tissue engineering.Appl Mater Today. 2020 Sep;20:100752. doi: 10.1016/j.apmt.2020.100752. Epub 2020 Jul 30. Appl Mater Today. 2020. PMID: 32856000 Free PMC article.
-
A parallel fluid-solid coupling model using LAMMPS and Palabos based on the immersed boundary method.J Comput Sci. 2018 Mar;25:89-100. doi: 10.1016/j.jocs.2018.02.006. Epub 2018 Feb 14. J Comput Sci. 2018. PMID: 30220942 Free PMC article.
-
Computational analysis of cancer cell adhesion in curved vessels affected by wall shear stress for prediction of metastatic spreading.Front Bioeng Biotechnol. 2024 May 27;12:1393413. doi: 10.3389/fbioe.2024.1393413. eCollection 2024. Front Bioeng Biotechnol. 2024. PMID: 38860135 Free PMC article.
-
Label-free sorting of soft microparticles using a bioinspired synthetic cilia array.Biomicrofluidics. 2018 May 21;12(4):042206. doi: 10.1063/1.5022500. eCollection 2018 Jul. Biomicrofluidics. 2018. PMID: 29861817 Free PMC article.
-
Review on Microbubbles and Microdroplets Flowing through Microfluidic Geometrical Elements.Micromachines (Basel). 2020 Feb 15;11(2):201. doi: 10.3390/mi11020201. Micromachines (Basel). 2020. PMID: 32075302 Free PMC article. Review.
References
-
- Twombly Renee. “Cancer surpasses heart disease as leading cause of death for all but the very elderly”. In: Journal of the National Cancer Institute 975 (2005), pp. 330–331. - PubMed
-
- Pantel Klaus and Alix-Panabières Catherine. “Circulating tumour cells in cancer patients: challenges and perspectives”. In: Trends in molecular medicine 169 (2010), pp. 398–406. - PubMed
-
- Cross Sarah E et al. “Nanomechanical analysis of cells from cancer patients”. In: Nature nanotechnology 212 (2007), pp. 780–783. - PubMed
Grants and funding
LinkOut - more resources
Full Text Sources
