

An RNA-seq-Based Expression Profiling of Radiation-Induced Esophageal Injury in a Rat Model
- PMID: 31105479
- PMCID: PMC6505253
- DOI: 10.1177/1559325819843373
An RNA-seq-Based Expression Profiling of Radiation-Induced Esophageal Injury in a Rat Model
Abstract
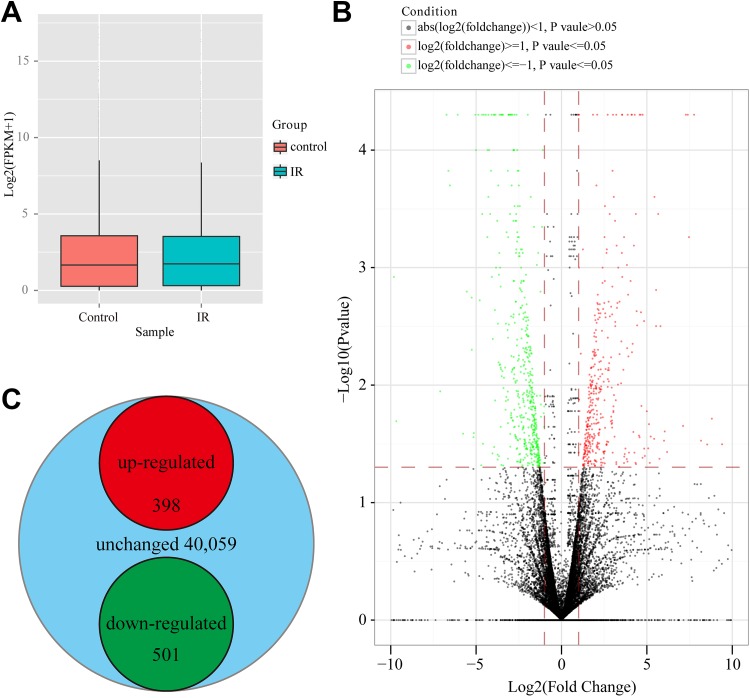
Radiation-induced acute injury is the main reason for the suspension of radiotherapy and unsuccessful treatment of cancer. It is of great importance to understand the molecular mechanism of radiation-induced esophageal injury. We used RNA-seq data from normal esophageal tissue and irradiated esophageal tissues and applied computational approaches to identify and characterize differentially expressed genes and detected 40 059 messenger RNAs (mRNAs) previously annotated and 717 novel long noncoding RNAs (lncRNAs). There were 14 upregulated and 32 downregulated lncRNAs among the differentially expressed lncRNA group. Their target genes were involved in the mRNA surveillance pathway, pathological immune responses, and cellular homeostasis. Additionally, we found 853 differentially expressed mRNAs, and there were 384 upregulated and 469 downregulated mRNAs. Notably, we found that the differentially expressed mRNAs were enriched for steroid biosynthesis, the tumor necrosis factor signaling pathway, focal adhesion, pathways in cancer, extracellular matrix-receptor interaction, and so on. The response of normal esophageal tissues to ionizing radiation is multifarious. The radiation-induced cell damage response by multiple pathways followed by pathological immune responses activated. Studies on the dynamic network of molecules involved in radiation-induced esophageal injury are under way to clarify the regulatory mechanisms and identify the candidate targets.
Keywords: RNA-sequence; esophageal injury; ionizing radiation; lncRNAs; mRNA.
Conflict of interest statement
Declaration of Conflicting Interests: The author(s) declared no potential conflicts of interest with respect to the research, authorship, and/or publication of this article.
Figures


Similar articles
-
Profiling circRNA and miRNA of radiation-induced esophageal injury in a rat model.Sci Rep. 2018 Oct 2;8(1):14605. doi: 10.1038/s41598-018-33038-1. Sci Rep. 2018. PMID: 30279559 Free PMC article.
-
Transcriptome alteration spectrum in rat lung induced by radiotherapy.Sci Rep. 2019 Dec 23;9(1):19701. doi: 10.1038/s41598-019-56027-4. Sci Rep. 2019. PMID: 31873113 Free PMC article.
-
Transcriptome profiling of lncRNA and co-expression networks in esophageal squamous cell carcinoma by RNA sequencing.Tumour Biol. 2016 Oct;37(10):13091-13100. doi: 10.1007/s13277-016-5227-3. Epub 2016 Jul 23. Tumour Biol. 2016. PMID: 27449043
-
Identification of messenger and long noncoding RNAs associated with gallbladder cancer via gene expression profile analysis.J Cell Biochem. 2019 Dec;120(12):19377-19387. doi: 10.1002/jcb.28953. Epub 2019 Sep 9. J Cell Biochem. 2019. PMID: 31498480
-
Mechanisms of radiation-induced tissue damage and response.MedComm (2020). 2024 Sep 20;5(10):e725. doi: 10.1002/mco2.725. eCollection 2024 Oct. MedComm (2020). 2024. PMID: 39309694 Free PMC article. Review.
Cited by
-
Exploring Relevant mRNAs and miRNAs in Injured Urethral Tissues of Rats with High-Throughput Sequencing.Genes (Basel). 2022 May 5;13(5):824. doi: 10.3390/genes13050824. Genes (Basel). 2022. PMID: 35627209 Free PMC article.
-
Microarray analysis identifies coding and non-coding RNA markers of liver injury in whole body irradiated mice.Sci Rep. 2023 Jan 5;13(1):200. doi: 10.1038/s41598-022-26784-w. Sci Rep. 2023. PMID: 36604457 Free PMC article.
-
Transcriptome Profiling Unveils a Critical Role of IL-17 Signaling-Mediated Inflammation in Radiation-Induced Esophageal Injury in Rats.Dose Response. 2022 Jun 2;20(2):15593258221104609. doi: 10.1177/15593258221104609. eCollection 2022 Apr-Jun. Dose Response. 2022. PMID: 35677348 Free PMC article.
-
Identification of lncRNA, MicroRNA, and mRNA-Associated CeRNA Network of Radiation-Induced Lung Injury in a Mice Model.Dose Response. 2019 Dec 12;17(4):1559325819891012. doi: 10.1177/1559325819891012. eCollection 2019 Oct-Dec. Dose Response. 2019. PMID: 31853236 Free PMC article.
-
Whole Transcriptome-Based ceRNA Regulatory Network Analysis of Radiation-Induced Esophageal Epithelial Cell Injury.Biologics. 2025 Apr 22;19:231-249. doi: 10.2147/BTT.S496064. eCollection 2025. Biologics. 2025. PMID: 40296868 Free PMC article.
References
-
- Siegel RL, Miller KD, Jemal A. Cancer Statistics, 2015. CA Cancer J Clin. 2015;65(1):5–29. - PubMed
-
- Chen W, Zheng R, Baade PD, et al. Cancer Statistics in China, 2015. CA Cancer J Clin. 2016;66(2):115–132. - PubMed
-
- Pennathur A, Gibson MK, Jobe BA, Luketich JD. Oesophageal carcinoma. Lancet. 2013;381(9864):400–412. - PubMed
-
- Wang N, Jia Y, Wang J, et al. Prognostic significance of lymph node ratio in esophageal cancer. Tumour Biol. 2015;36(4):2335–2341. - PubMed
LinkOut - more resources
Full Text Sources
