. 2019 Apr 17:10:783.
doi: 10.3389/fimmu.2019.00783. eCollection 2019.

PD-1 Dynamically Regulates Inflammation and Development of Brain-Resident Memory CD8 T Cells During Persistent Viral Encephalitis

Affiliations

PD-1 Dynamically Regulates Inflammation and Development of Brain-Resident Memory CD8 T Cells During Persistent Viral Encephalitis

Shwetank et al. Front Immunol. .

Abstract

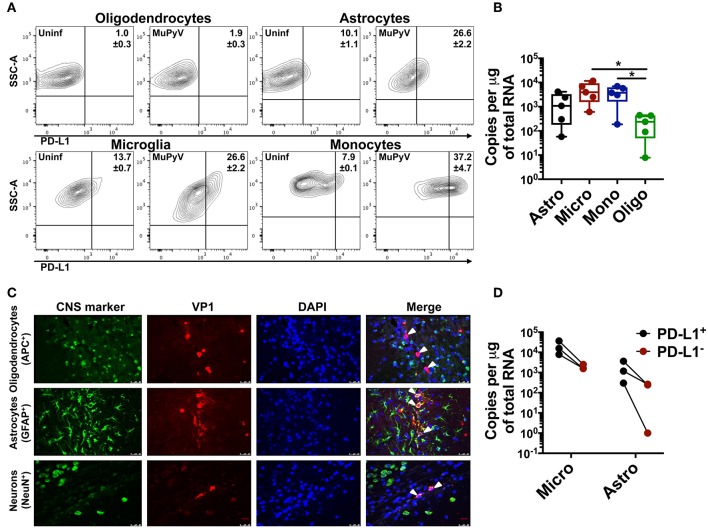
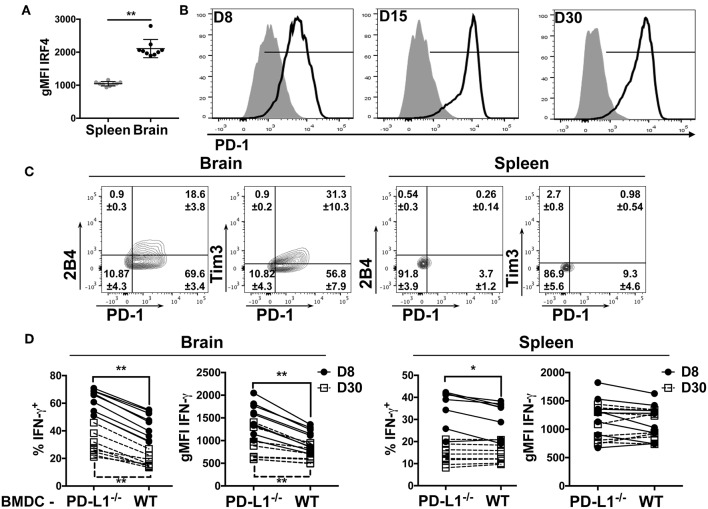
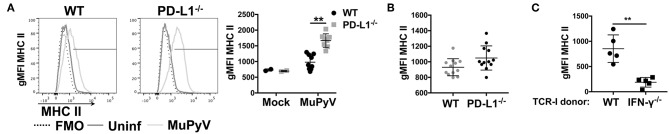
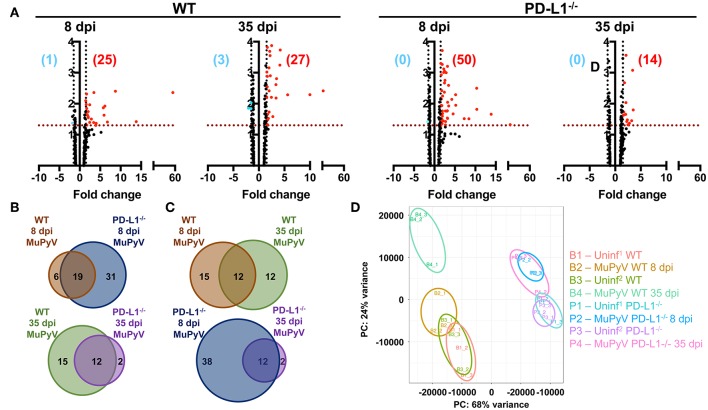
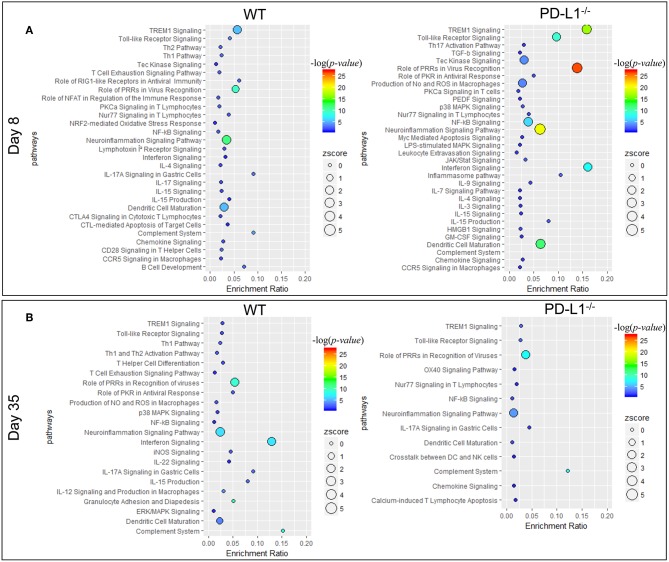
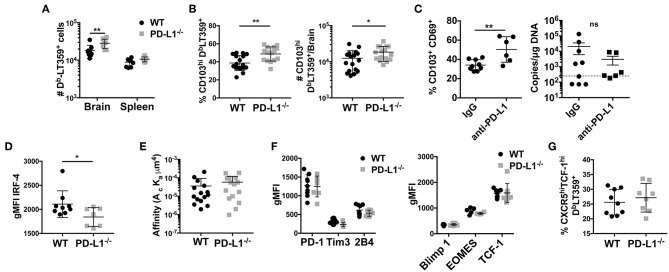
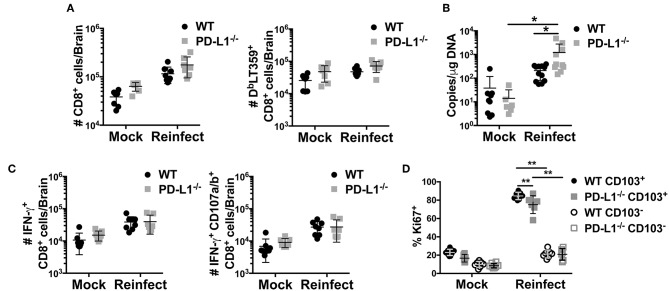
Programmed cell death-1 (PD-1) receptor signaling dampens the functionality of T cells faced with repetitive antigenic stimulation from chronic infections or tumors. Using intracerebral (i.c.) inoculation with mouse polyomavirus (MuPyV), we have shown that CD8 T cells establish a PD-1hi, tissue-resident memory population in the brains (bTRM) of mice with a low-level persistent infection. In MuPyV encephalitis, PD-L1 was expressed on infiltrating myeloid cells, microglia and astrocytes, but not on oligodendrocytes. Engagement of PD-1 on anti-MuPyV CD8 T cells limited their effector activity. NanoString gene expression analysis showed that neuroinflammation was higher in PD-L1-/- than wild type mice at day 8 post-infection, the peak of the MuPyV-specific CD8 response. During the persistent phase of infection, however, the absence of PD-1 signaling was found to be associated with a lower inflammatory response than in wild type mice. Genetic disruption and intracerebroventricular blockade of PD-1 signaling resulted in an increase in number of MuPyV-specific CD8 bTRM and the fraction of these cells expressing CD103, the αE integrin commonly used to define tissue-resident T cells. However, PD-L1-/- mice persistently infected with MuPyV showed impaired virus control upon i.c. re-infection with MuPyV. Collectively, these data reveal a temporal duality in PD-1-mediated regulation of MuPyV-associated neuroinflammation. PD-1 signaling limited the severity of neuroinflammation during acute infection but sustained a level of inflammation during persistent infection for maintaining control of virus re-infection.

Keywords: CD8 T cells; PD-1; PD-L1; mouse polyomavirus; neuroinflammation; tissue-resident memory; viral encephalitis.


Figures

Figure 1
Figure 1
Neural cells express PD-L1. (A) Representative contour plots with frequency of PD-L1+ oligodendrocytes (CD11bneg/CD45neg/O4+), astrocytes (CD11bneg/CD45neg/GLAST+), microglia (CD11bhi/CD45int) and infiltrating monocytes (CD11bhi/CD45hi) from mock inoculated controls and MuPyV-infected mice at 8 dpi. The gates were drawn on the basis of the fluorescence minus one (FMO) controls. (B) LT-Ag mRNA copy number from FACS-purified astrocytes (Astro), microglia (Micro), infiltrating monocytes (Mono), and oligodendrocytes (Oligo). Ct values were normalized to the amount of total RNA taken for cDNA synthesis. Each point represents data from a pool of 3 mice. (C) Fluorescence photomicrographs of FFPE brain tissue sections from mice euthanized at 4 dpi stained with antibodies specific for the indicated CNS cell markers (green) and for MuPyV capsid protein VP1 (red). Nuclei were counterstained with DAPI (blue). White arrows in merged images indicate VP1+ cells (magnification 400X). (D) LT-Ag mRNA copy numbers from FACS-purified PD-L1+ and PD-L1 microglia and astrocytes. Ct values were normalized with the Ct value of TBP mRNA for each cell type between the PD-L1+ and PD-L1 samples. Each point connected by a line indicates cells from a pool of 3 mice. Data are cumulative from two independent experiments with 2–4 mice per group. Two-way ANOVA with Tukey multiple comparison test was performed. Values represent mean ± SD; *p ≤ 0.05.
Figure 2
Figure 2
bTRM express PD-1 during MuPyV infection. (A) Expression of IRF4 by DbLT359-specific CD8 T cells from brains and spleens of WT mice at 45 dpi in the indicated groups, represented as gMFI of the population. (B) Representative histograms of PD-1 expression by DbLT359+ CD8 T cells from brain (solid-line) or spleen (shaded) at the indicated dpi. (C) Representative contour plots with frequencies of Tim3/PD-1 and 2B4/PD-1 expressing brain-infiltrating virus-specific CD8 T cells at 45 dpi. (D) Frequency and gMFI of IFN-γ+ CD44+ CD8 T cells from the brain and spleen at the indicated timepoints upon in vitro stimulation with the LT359 peptide-pulsed BMDC from WT and PD-L1−/− mice. Each point connected by a line indicates cells from one mouse. Data are from two independent experiments with 4-5 mice per group. Mann Whitney tests (A) between WT and PD-L1−/− groups and Wilcoxon matched-pairs signed rank test (D) were performed. Values represent mean ± SD; *p ≤ 0.05, **p ≤ 0.01, not significant (ns) p > 0.05.
Figure 3
Figure 3
Lack of PD-1 signaling augments CD8 T cell IFN-γ production in vivo. (A) Representative histograms of MHC class II expression on microglia from WT and PD-L1−/− mice at 8 dpi (left panel) with mean ± SD of MHC II gMFI (right panel). (B) MHC II gMFI (mean ± SD) on microglia at 45 dpi. (C) MHC II gMFI on microglia from WT mice at 8 dpi after i.v. transfer of IFN-γ sufficient or IFN-γ−/− naïve TCR-I cells at day−1. Combined data from 2 to 3 independent experiments with 2–4 mice per group; each value indicates cells isolated from an individual mouse. Two-way ANOVA with Tukey multiple comparison test (A) or Mann Whitney test (C) was performed. **p ≤ 0.01.
Figure 4
Figure 4
Brains of WT mice and PD-L1−/− mice undergo dynamic and disparate changes in inflammatory transcriptomes from acute to persistent phases of infection. (A) Volcano plots representing differentially expressed genes (fold change ≥1.5 and p ≤ 0.05) of MuPyV infected WT brain samples vs. mock inoculated WT control brains and MuPyV infected PD-L1−/− brains vs. mock inoculated PD-L1−/− brains at 8 dpi and 35 dpi. Combined data from a total of 3 pools of 3 mice per pool. Downregulated and upregulated genes are represented in blue and red dots, respectively. Similarly, numbers in blue and red represent the number of downregulated and upregulated genes, respectively. The y-axis represents –log(p-value) for each gene in the NanoString mouse inflammation panel. (B,C) Venn diagrams showing the overlap in the differentially regulated genes between each group as indicated. (D) PCA of each pooled sample was performed using normalized counts of all genes in the array. Uninf1 and Uninf2 are two independent sets of mock infected controls samples run along with the 8 dpi and 35 dpi MuPyV-infected samples, respectively.
Figure 5
Figure 5
PD-1 signaling alters inflammatory pathways in the brain during MuPyV infection. Pathway enrichment analysis of the differentially expressed genes between MuPyV-infected WT vs. mock-inoculated WT control (left panel), and MuPyV-infected PD-L1−/− vs. mock-inoculated PD-L1−/− control brain (right panel) at 8 dpi (A) and 35 dpi (B) using IPA software. The y-axis represents pathway and the x-axis represents enrichment ratio. Bubble size represents the z-score and color represents the -log(p-value) calculated by Fisher's exact test.
Figure 6
Figure 6
Lack of PD-1 signaling is associated with an increased frequency of CD103+ bTRM (A) Number of DbLT359 specific CD8 T cells in WT and PD-L1−/− mice. (B) Frequency and number of brain CD103+ DbLT359+ CD8 T cells in WT and PD-L1−/− mice. (C) Frequency of CD103+DbLT359+CD69+ CD8 T cells and viral DNA load at 30 dpi in brains of WT mice with control IgG or PD-L1 antibody delivered by i.c.v. cannulae. (D) gMFI of IRF4 expression by DbLT359+ T cells at 9 and 45 dpi. (E) TCR affinities of DbLT359 monomer-binding CD8 T cells determined by 2D-micropipette adhesion assay. Data are from a pool of 5 mice. (F) gMFI of PD-1, Tim3, and 2B4 (left panel), and Blimp-1, EOMES, and TCF-1 (right panel). (G) Frequency of TCF-1+CXCR5+ DbLT359+ CD8 T cells from the brains of mice at 45 dpi. Data are from two to three independent experiments with 3–8 mice per group. Mann Whitney test between WT and PD-L1−/− groups was performed in panels B, C, and D; two-way ANOVA with Tukey multiple comparison test in panel A was performed. Values represent mean ± SD; *p ≤ 0.05, **p ≤ 0.01, not significant (ns) p>0.05.
Figure 7
Figure 7
Lack of PD-1 signaling results in impaired viral control. WT or PD-L1−/− mice were re-infected i.c. with MuPyV or mock inoculated at 35 dpi, then euthanized 5 days later. Total CD8 T cells and DbLT359+ CD8 T cells from brains were analyzed by flow cytometry. (A) Number of total CD8 and DbLT359+ CD8 T cells per brain, (B) Brain viral DNA genome copies by qPCR at 5 days after re-infection. (C) Number of IFN-γ+ (left panel) and IFN-γ+ CD107a/b+ (right panel) CD8 T cells upon in vitro stimulation with LT359 peptide. (D) Frequency of Ki67+ LT359+ CD103+/− CD8 T cells upon reinfection. Data from two independent experiments with 3–5 mice per group. Two-way ANOVA with Tukey multiple comparison test was performed. Values represent mean ± SD; *p ≤ 0.05, **p ≤ 0.01. (D) Frequency of Ki67+ LT359+ CD103+/− CD8 T cells upon reinfection.

Similar articles

Cited by

References

    1. Virgin HW, Wherry EJ, Ahmed R. Redefining chronic viral infection. Cell. (2009) 138:30–50. 10.1016/j.cell.2009.06.036 - DOI - PubMed
    1. Wherry EJ. T cell exhaustion. Nat Immunol. (2011) 12:492–9. 10.1038/ni.2035 - DOI - PubMed
    1. Okazaki T, Maeda A, Nishimura H, Kurosaki T, Honjo T. PD-1 immunoreceptor inhibits B cell receptor-mediated signaling by recruiting src homology 2-domain-containing tyrosine phosphatase 2 to phosphotyrosine. Proc Natl Acad Sci USA. (2001) 98:13866–71. 10.1073/pnas.231486598 - DOI - PMC - PubMed
    1. Chemnitz JM, Parry RV, Nichols KE, June CH, Riley JL. SHP-1 and SHP-2 associate with immunoreceptor tyrosine-based switch motif of programmed death 1 upon primary human T cell stimulation, but only receptor ligation prevents T cell activation. J Immunol. (2004) 173:945–54. 10.4049/jimmunol.173.2.945 - DOI - PubMed
    1. Latchman Y, Wood CR, Chernova T, Chaudhary D, Borde M, Chernova I, et al. . PD-L2 is a second ligand for PD-1 and inhibits T cell activation. Nat Immunol. (2001) 2:261–8. 10.1038/85330 - DOI - PubMed

Publication types

MeSH terms