. 2019 Apr 24:10:804.
doi: 10.3389/fimmu.2019.00804. eCollection 2019.

Notch-Mediated Tumor-Stroma-Inflammation Networks Promote Invasive Properties and CXCL8 Expression in Triple-Negative Breast Cancer

Affiliations

Notch-Mediated Tumor-Stroma-Inflammation Networks Promote Invasive Properties and CXCL8 Expression in Triple-Negative Breast Cancer

Yulia Liubomirski et al. Front Immunol. .

Abstract

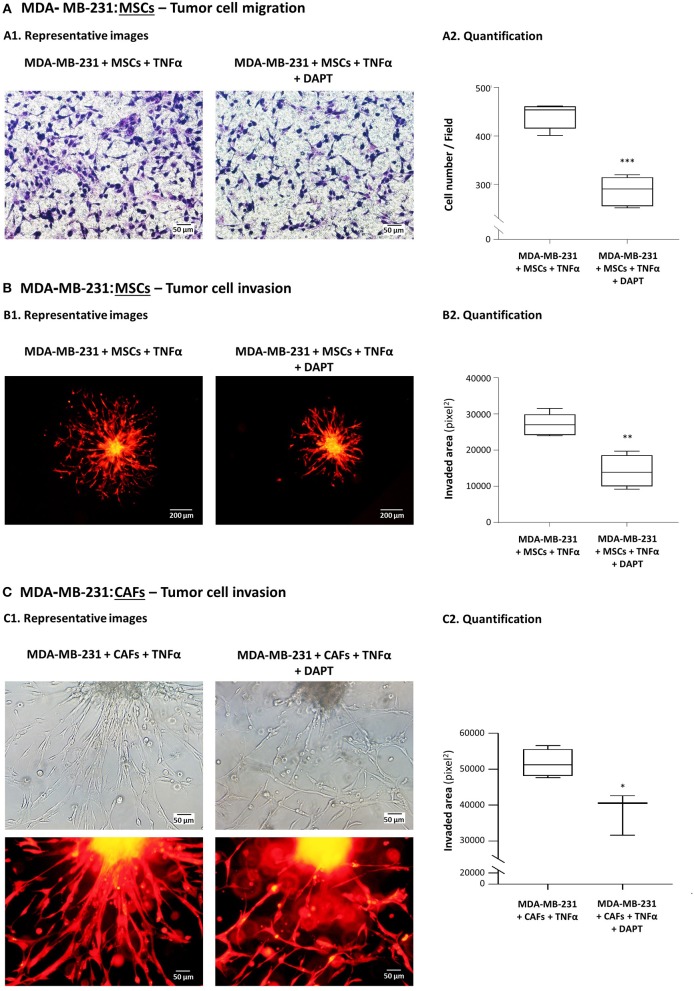
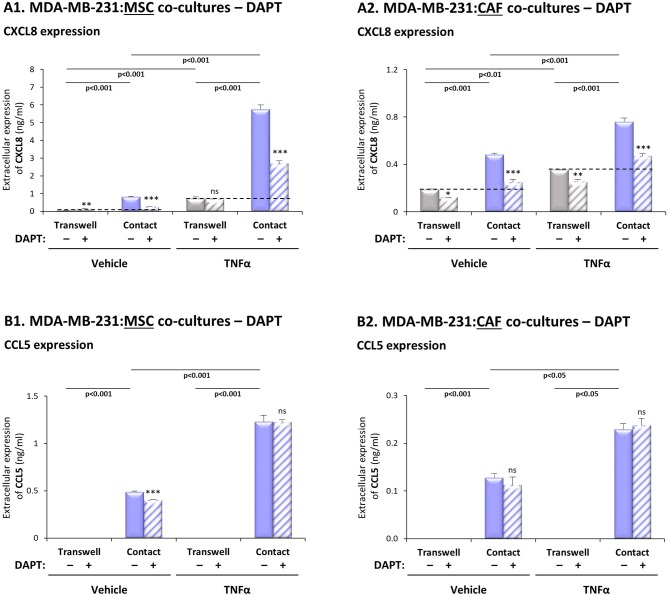
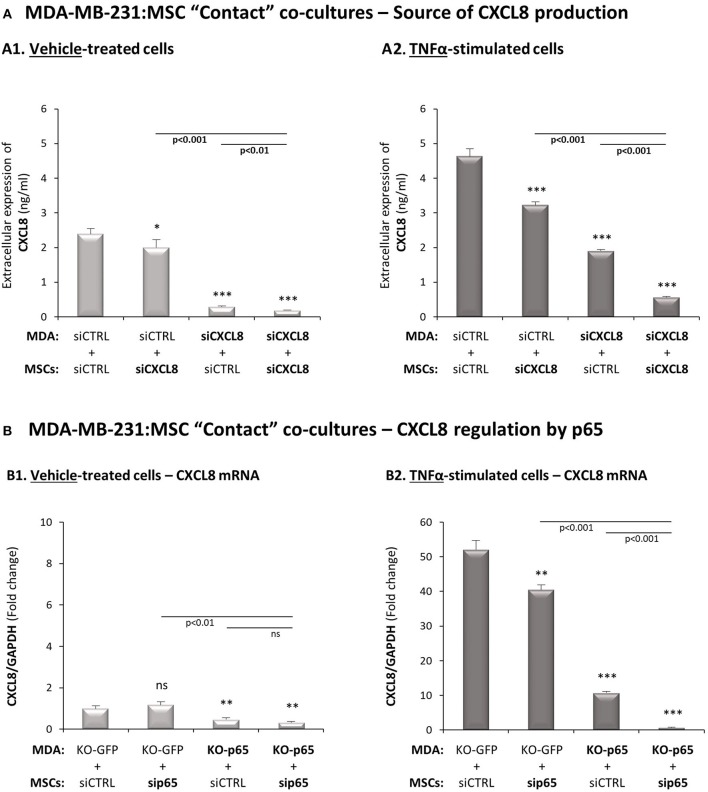
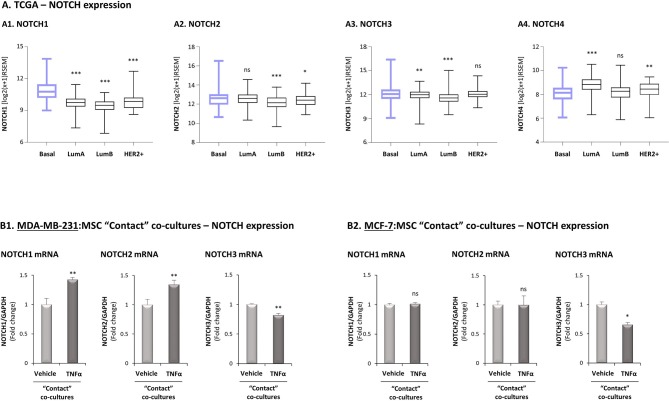
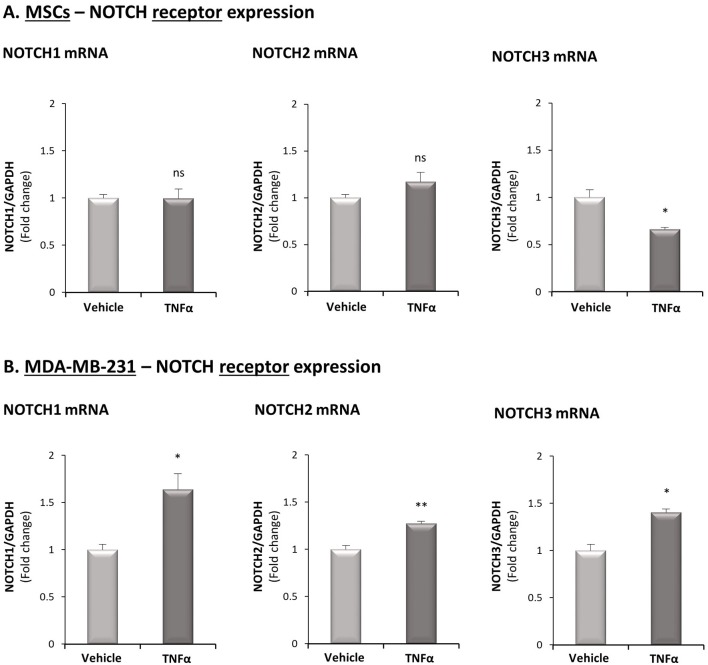
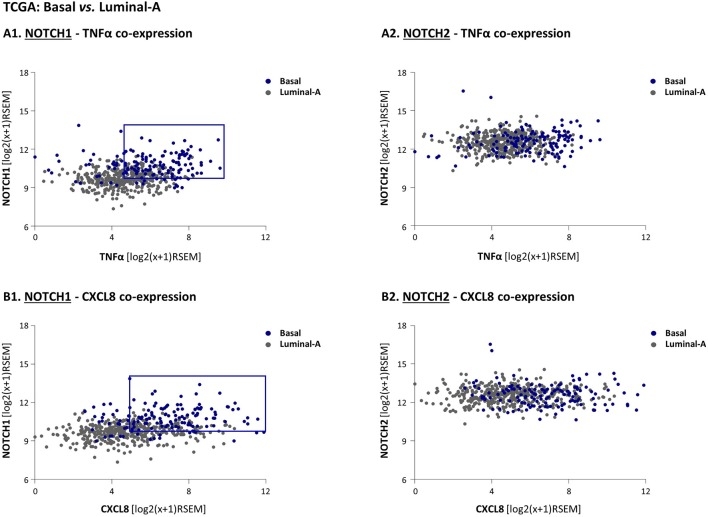
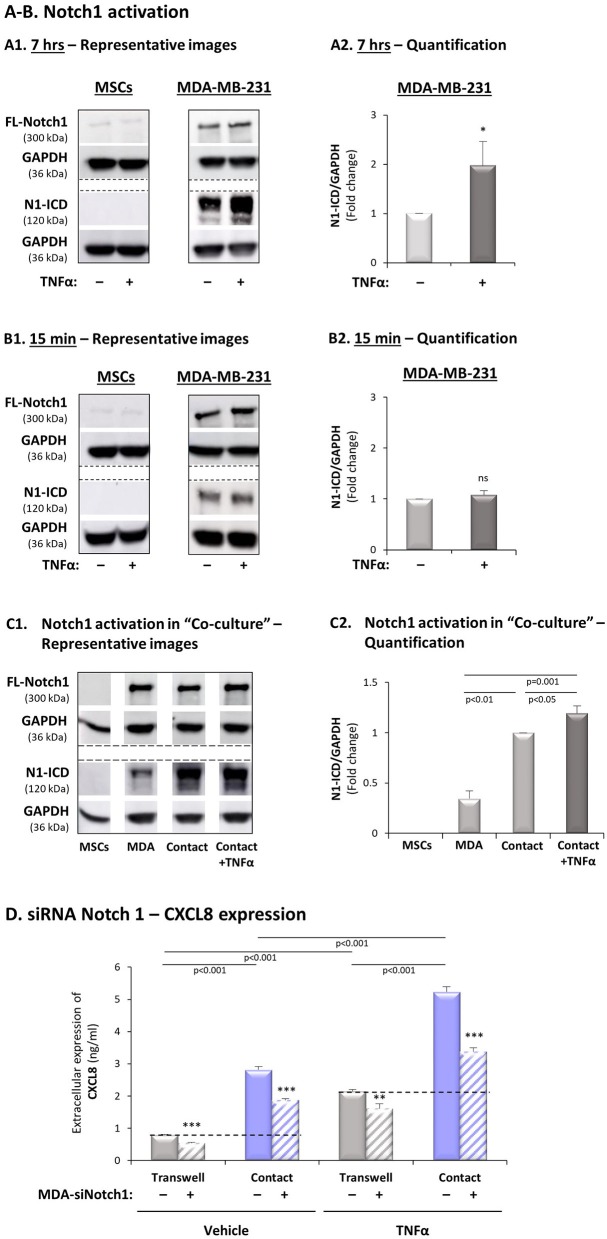
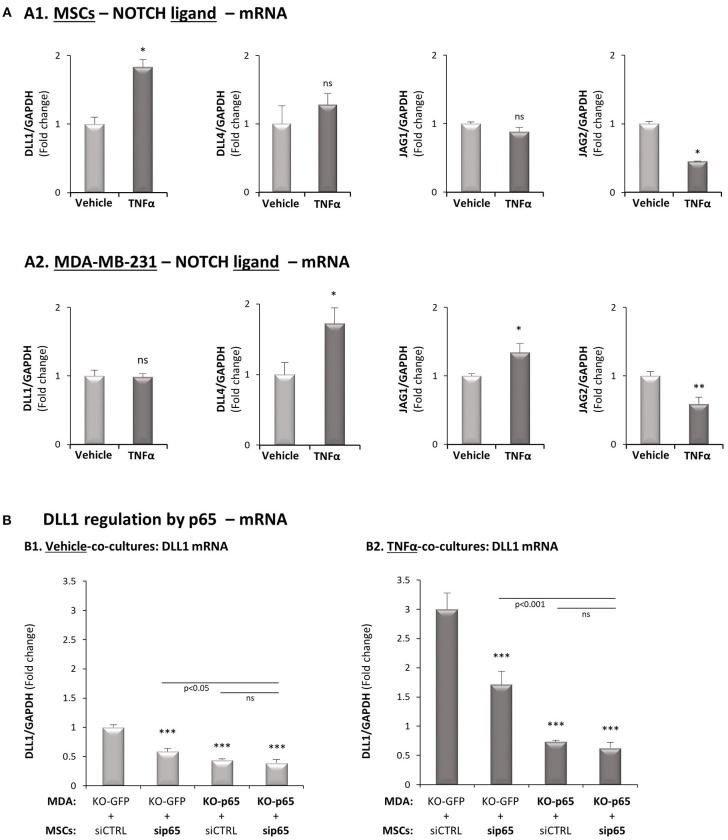
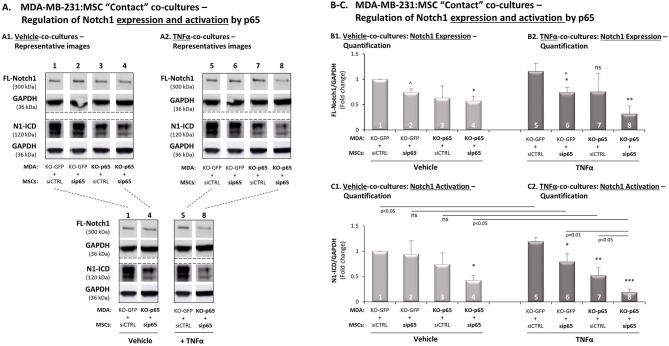
Stromal cells and pro-inflammatory cytokines play key roles in promoting the aggressiveness of triple-negative breast cancers (TNBC; Basal/Basal-like). In our previous study we demonstrated that stimulation of TNBC and mesenchymal stem cells (MSCs) co-cultures by the pro-inflammatory cytokine tumor necrosis factor α (TNFα) has led to increased metastasis-related properties in vitro and in vivo. In this context, elevated release of the pro-metastatic chemokines CXCL8 (IL-8) and CCL5 (RANTES) was noted in TNFα- and interleukin-1β (IL-1β)-stimulated TNBC:MSC co-cultures; the process was partly (CXCL8) and entirely (CCL5) dependent on physical contacts between the two cell types. Here, we demonstrate that DAPT, inhibitor of γ-secretase that participates in activation of Notch receptors, inhibited the migration and invasion of TNBC cells that were grown in "Contact" co-cultures with MSCs or with patient-derived cancer-associated fibroblasts (CAFs), in the presence of TNFα. DAPT also inhibited the contact-dependent induction of CXCL8, but not of CCL5, in TNFα- and IL-1β-stimulated TNBC:MSC/CAF co-cultures; some level of heterogeneity between the responses of different TNBC cell lines was noted, with MDA-MB-231:MSC/CAF co-cultures being the most sensitive to DAPT. Patient dataset studies comparing basal tumors to luminal-A tumors, and mRNA analyses of Notch receptors in TNBC and luminal-A cells pointed at Notch1 as possible mediator of CXCL8 increase in TNFα-stimulated TNBC:stroma "Contact" co-cultures. Accordingly, down-regulation of Notch1 in TNBC cells by siRNA has substantially reduced the contact-dependent elevation in CXCL8 in TNFα- and also in IL-1β-stimulated TNBC:MSC "Contact" co-cultures. Then, studies in which CXCL8 or p65 (NF-κB pathway) were down-regulated (siRNAs; CRISPR/Cas9) in TNBC cells and/or MSCs, indicated that upon TNFα stimulation of "Contact" co-cultures, p65 was activated and led to CXCL8 production mainly in TNBC cells. Moreover, our findings indicated that when tumor cells interacted with stromal cells in the presence of pro-inflammatory stimuli, TNFα-induced p65 activation has led to elevated Notch1 expression and activation, which then gave rise to elevated production of CXCL8. Overall, tumor:stroma interactions set the stage for Notch1 activation by pro-inflammatory signals, leading to CXCL8 induction and consequently to pro-metastatic activities. These observations may have important clinical implications in designing novel therapy combinations in TNBC.

Keywords: CXCL8; cancer-associated fibroblasts; interleukin 1β; mesenchymal stem cells; notch1; p65; triple-negative breast cancer; tumor necrosis factor α.


Figures

Figure 1
Figure 1
DAPT inhibits the migratory and invasive properties gained by TNBC cells following their interactions with MSCs in the presence of TNFα stimulation. (A) Tumor cell migration. mCherry-MDA-MB-231 cells and MSCs were cultured together in migration transwells in the presence of TNFα (10 ng/ml), with DAPT (10 μM) or with its vehicle control (DMSO) in serum-free media. Tumor cell migration was determined toward medium containing 10% FBS, after 12 h. Comparisons of migration of MDA-MB-231 cells following interactions with MSCs and TNFα stimulation to migration of the tumor cells grown in control conditions (without MSCs and TNFα) were presented in our previous study (26). In the current Figure: (A1) Representative photos (Bar, 50 μm) and (A2) quantifications of multiple photos by ImageJ are provided. ***p < 0.001. The photos and their quantifications are representatives of n = 3 independent experiments, performed with MSCs of 2 different donors. Parallel photos taken by fluorescence microscope indicated that migrating cells expressed mCherry, and thus consisted of tumor cells (Supplementary Figure 1). (B,C) Tumor cell invasion out of matrigel-embedded 3D spheroids. Spheroids containing mCherry-expressing MDA-MB-231 cells together with MSCs (B) or with breast cancer patient-derived CAFs (C) were formed in the presence of DAPT (10 μM) or its vehicle (DMSO). Then, spheroids were embedded in matrigel, were stimulated by TNFα (10 ng/ml) and supplemented with fresh DAPT (10 μM) or DMSO. Comparisons of invasion of MDA-MB-231 cells following interactions with MSCs and TNFα stimulation to invasion of the tumor cells grown in control conditions (without MSCs and TNFα) were presented in our previous study (26). In the current Figure: (B1,C1) Representative photos (Bar: 200 μm in B1, 50 μm in C1) and (B2,C2) quantifications of multiple photos by ImageJ are provided. **p < 0.01, *p < 0.05. The photos and their quantifications are representatives of n > 3 independent experiments, in Part (B) performed with MSCs of 2 different donors.
Figure 2
Figure 2
DAPT inhibits the contact-dependent induction of CXCL8, but not of CCL5, in TNFα-stimulated TNBC:stroma co-cultures. Co-cultures of MDA-MB-231 cells with MSCs (A1,B1) and co-cultures of MDA-MB-231 cells with breast cancer patient-derived CAFs (A2,B2) were established under “Transwell” conditions and “Contact” conditions. Co-cultures were stimulated by TNFα (10 ng/ml) or vehicle control for 7 h; then, TNFα stimulation was removed and the cells were grown in TNFα-free media with DAPT (10 μM) for additional 60 h. CM were collected and the extracellular expression of CXCL8 (A1,A2) and CCL5 (B1,B2) was determined by ELISA. ***p < 0.001, **p < 0.01, *p < 0.05, ns = non-significant for differences between DAPT- and DMSO-treated cells, within each group. The results are of a representative experiment of n > 3 independent experiments, performed with MSCs of 2 different donors, and of n = 3 independent experiments performed with patient-derived CAFs. To provide the readers with the entire setup of co-culture conditions compared to separate cells, as we have demonstrated in our previous study (26), Supplementary Figures 2A,B; demonstrate the entire panel of cells/stimulations relevant to CXCL8 and CCL5 induction (without DAPT treatment). The results presented in Supplementary Figure 2 were derived from a different experiment than those presented in our previous study.
Figure 3
Figure 3
In TNFα-stimulated TNBC:MSC “Contact” co-cultures, mainly TNBC cells but also MSCs contribute to elevated levels of CXCL8, through a p65-dependent process. (A) The cellular source of CXCL8. siRNA to CXCL8 was expressed in MDA-MB-231 cells (“MDA”), in MSCs or both cell types together (validation of CXCL8 down-regulation is demonstrated in Supplementary Figure 4A), and “Contact” co-cultures were established in the presence of vehicle (A1) or TNFα (10 ng/ml) (A2). CXCL8 levels in cell supernatants were determined by ELISA, as described in Figure 2. ***p < 0.001, *p < 0.05 for differences between co-culture combinations that included siCXCL8-expressing cells, compared to co-cultures in which both cell types expressed siCTRL. The results are of a representative experiment of n = 3 independent experiments, performed with MSCs of 2 different donors. (B) Regulation of CXCL8 expression by p65. p65 was down-regulated in MDA-MB-231 cells (“MDA”), MSCs or both cell types together (validations of p65 down-regulation are demonstrated in Supplementary Figures 4B,C), and “Contact” co-cultures were established and were exposed to vehicle (B1) or to TNFα (10 ng/ml) (B2). CXCL8 mRNA levels were determined by qRT-PCR. ***p < 0.001, **p < 0.01, ns=non-significant for differences between different sip65/siCTRL and KO-GFP/KO-p65 cell combinations compared to siCTRL/KO-GFP control groups. The results are of representative experiment of n > 3 independent experiments, performed with MSCs of 3 different donors.
Figure 4
Figure 4
Studies of the TCGA breast cancer patient dataset and of transcriptional regulation demonstrate high relevance of Notch1 to the tumor-stroma-inflammation network in TNBC. (A) The Figure demonstrates gene expression boxplot analyses, performed using the TCGA breast cancer patient dataset. (A1) NOTCH1. (A2) NOTCH2. (A3) NOTCH3. (A4) NOTCH4. ***p < 0.001, **p < 0.01 *p < 0.05, ns = non-significant for differences between the expression of NOTCH receptors in luminal-A, luminal-B and HER2+ tumors compared to basal tumors. (B) mRNA expression levels of NOTCH1, NOTCH2 and NOTCH3 were determined by qRT-PCR in MDA-MB-231:MSC (B1) or MCF-7:MSC (B2) “Contact” co-cultures stimulated by TNFα (10 ng/ml) or vehicle control. **p < 0.01, *p < 0.05, ns=non-significant for differences between cytokine-stimulated and non-stimulated co-cultures. The results are of a representative experiment of n ≥ 3 independent experiments, performed with MSCs of 2 different donors.
Figure 5
Figure 5
TNFα up-regulates the expression of NOTCH1, NOTCH2 and NOTCH3 in TNBC cells but not in MSCs. The Figure demonstrates mRNA expression of NOTCH1, NOTCH2 and NOTCH3 in MSCs (A) and in MDA-MB-231 cells (B), following stimulation by TNFα (10 ng/ml) or vehicle control. **p < 0.01, *p < 0.05, ns = non-significant for differences between cytokine-stimulated and vehicle-treated cells. The results are of a representative experiment of n ≥ 3 independent experiments, performed with MSCs of 2 different donors.
Figure 6
Figure 6
High co-expression levels of NOTCH1 - but not of NOTCH2 - with TNFα and CXCL8 differentiate basal patients from luminal-A breast cancer patients. (A,B) The Figure demonstrates gene expression analyses, performed using the TCGA breast cancer dataset. The analyses demonstrate in individual patient tumor (dots) the co-expression of NOTCH1 with TNFα (A1); NOTCH2 with TNFα (A2); NOTCH1 with CXCL8 (B1); NOTCH2 with CXCL8 (B2). The blue rectangle illustrates the upwards-right shift observed in basal patients compared to luminal-A patients in NOTCH1 co-expression analyses (the rectangle was set as described in “Materials and methods”).
Figure 7
Figure 7
Expression of Notch1 siRNA in TNBC cells inhibits the contact-dependent induction of CXCL8, in TNFα-stimulated TNBC:MSC co-cultures. (A,B) Notch1 activation by TNFα stimulation in MSCs and MDA-MB-231 cells. Each of the two cell types was stimulated by TNFα (“+”; 10 ng/ml) or vehicle control (“–“) for 7 h (A) or 15 min (B). (A1,B1) Representative experiments and (A2,B2) averages ± SD values of Notch1 activation in n ≥ 3 independent experiments, performed with MSCs of 2 different donors. Notch1 activation levels were determined by WB analyses of N1-ICD = Notch1 intracellular domain. FL-Notch1 = Full-length Notch1. GAPDH was used as a loading control. *p < 0.05, ns = non-significant for differences between cytokine-stimulated cells and control non-stimulated MDA-MB-231 cells (MSCs are not presented in the graphs because no N1-ICD signals were detected). (C) Notch1 activation was determined in MDA-MB-231 (“MDA”) cells, MSCs and “Contact” co-cultures that were stimulated by TNFα (10 ng/ml), or exposed to vehicle for 7 h. (C1) A representative experiment and (C2) averages ± SD of Notch1 activation in n = 3 independent experiments, performed with MSCs of 3 different donors. WB analyses were performed as described in Part (A) above. (D) The effects of siRNA Notch1 on CXCL8 expression (validation of Notch1 down-regulation is demonstrated in Supplementary Figure 4D). MDA-MB-231 cells (“MDA”) transfected by Notch1 siRNA (“+”) or siCTRL (“–”) and were co-cultured with MSCs. Then, co-cultures were stimulated by TNFα (10 ng/ml) or by vehicle control, and extracellular expression of CXCL8 was determined by ELISA, as described in Figure 2. ***p < 0.001, **p < 0.01 for differences between groups containing siNotch1-expressing MDA-MB-231 cells and groups of siCTRL-expressing MDA-MB-231 cells. The results are of a representative experiment of n = 3 independent experiments, performed with MSCs of 2 different donors.
Figure 8
Figure 8
DLL1 is up-regulated in MSCs following TNFα stimulation and is controlled by p65 activation. (A) The Figure demonstrates mRNA expression levels of Notch ligands, determined by qRT-PCR in MSCs (A1) or in MDA-MB-231 cells (A2), stimulated by TNFα (10 ng/ml) or vehicle control for 7 h. **p < 0.01, *p < 0.05, ns = non-significant for differences between cytokine-stimulated and vehicle-treated co-cultures. (B) DLL1 regulation by p65. p65 was down-regulated in MDA-MB-231 cells (“MDA”), MSCs or both cell types together (as in Figure 3B) and both cell types were co-cultured in “Contact” conditions. Then, co-cultures were stimulated by TNFα (10 mg/ml) or exposed to vehicle control, and DLL1 mRNA was determined by qRT-PCR. ***p < 0.001, ns = non-significant. In all parts of the Figure, the results are of a representative experiment of n ≥ 3 independent experiments, performed with MSCs of 2 different donors.
Figure 9
Figure 9
In TNFα-stimulated TNBC:MSC co-cultures, p65 activation up-regulates Notch1 expression and activation. The Figure demonstrates studies performed following p65 down-regulation in MDA-MB-231 cells (“MDA”), MSCs or both cell types together, as described in Figure 3B (validations of p65 down-regulation are demonstrated in Figures S4B,C). (A) A representative experiment, (B) averages ± SD of Notch1 expression and (C) averages ± SD of Notch1 activation in n = 3 independent experiments (∧ In these groups, densitometry was performed in n = 2), performed with MSCs of 3 different donors. The two cell types were co-cultured in “Contact” conditions in different combinations, and were exposed to vehicle control (A1,B1,C1) or to TNFα stimulation (A2,B2,C2; 10 ng/ml). Notch1 activation levels were determined by WB analyses of N1-ICD = Notch1 intracellular domain. FL-Notch1 = Full-length Notch1. GAPDH was used as a loading control. ***p < 0.001, **p < 0.01, *p < 0.01, ns = non-significant for differences between different sip65/siCTRL and KO-GFP/KO-p65 cell combinations compared to siCTRL/KO-GFP control groups. For readers' convenience, Panel A also provides another view of the comparisons between specific lanes that were shown in (A1,A2). This approach was taken in order to clearly demonstrate the stronger reduction in Notch1 activation in TNFα-stimulated co-cultures following down-regulation of p65 in both cell types, compared to similar analyses performed without TNFα stimulation or without p65 down-regulation.

Similar articles

Cited by

References

    1. Gerratana L, Fanotto V, Bonotto M, Bolzonello S, Andreetta C, Moroso S, et al. Pattern of metastatic spread and prognosis of breast cancer biologic subtypes. J Clin Oncol. (2014) 32:125–33. 10.1200/jco.2014.32.15_suppl.e12532 - DOI
    1. Joensuu H, Gligorov J. Adjuvant treatments for triple-negative breast cancers. Ann Oncol. (2012) 23(Suppl. 6):vi40–5. 10.1093/annonc/mds194 - DOI - PubMed
    1. Bianchini G, Balko JM, Mayer IA, Sanders ME, Gianni L. Triple-negative breast cancer: challenges and opportunities of a heterogeneous disease. Nat Rev Clin Oncol. (2016) 13:674–90. 10.1038/nrclinonc.2016.66 - DOI - PMC - PubMed
    1. Matsumoto H, Koo SL, Dent R, Tan PH, Iqbal J. Role of inflammatory infiltrates in triple negative breast cancer. J Clin Pathol. (2015) 68:506–10. 10.1136/jclinpath-2015-202944 - DOI - PubMed
    1. Li Z, Qiu Y, Lu W, Jiang Y, Wang J. Immunotherapeutic interventions of Triple Negative Breast Cancer. J Transl Med. (2018) 16:147. 10.1186/s12967-018-1514-7 - DOI - PMC - PubMed

Publication types

MeSH terms