. 2019 Apr 25:10:870.
doi: 10.3389/fimmu.2019.00870. eCollection 2019.

The Axial Organ and the Pharynx Are Sites of Hematopoiesis in the Sea Urchin

Affiliations

The Axial Organ and the Pharynx Are Sites of Hematopoiesis in the Sea Urchin

Preethi Golconda et al. Front Immunol. .

Abstract

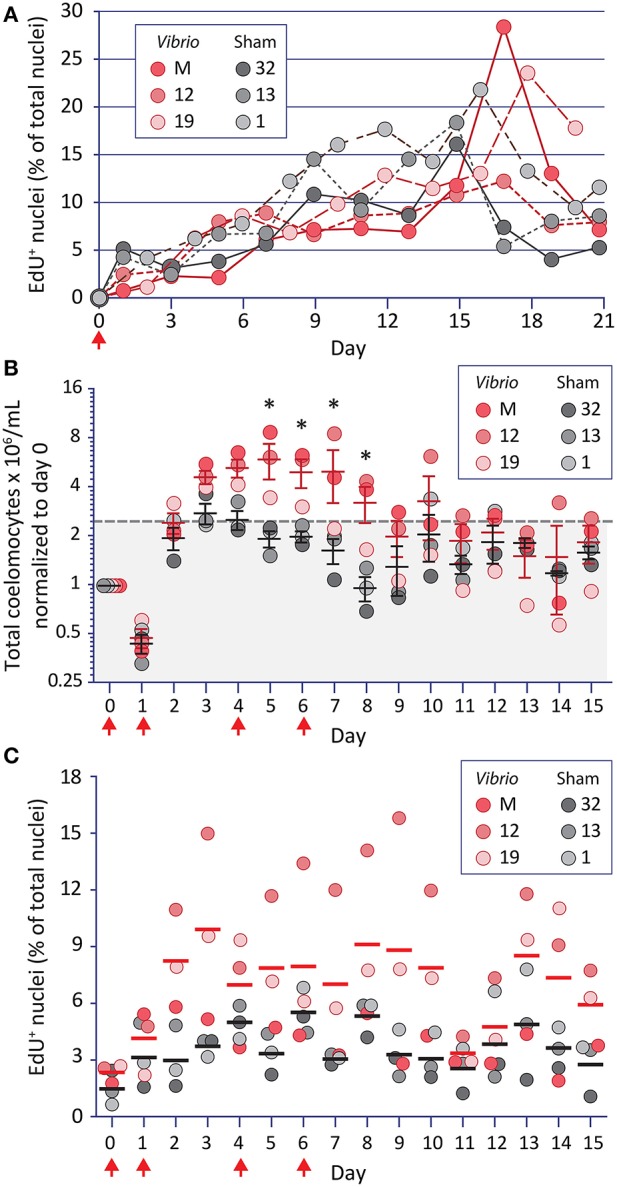
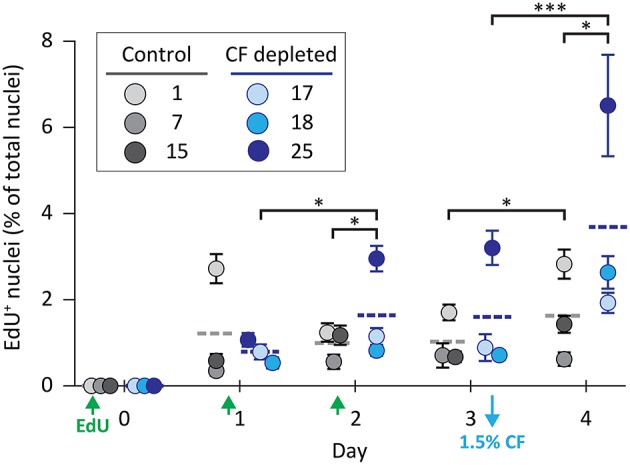
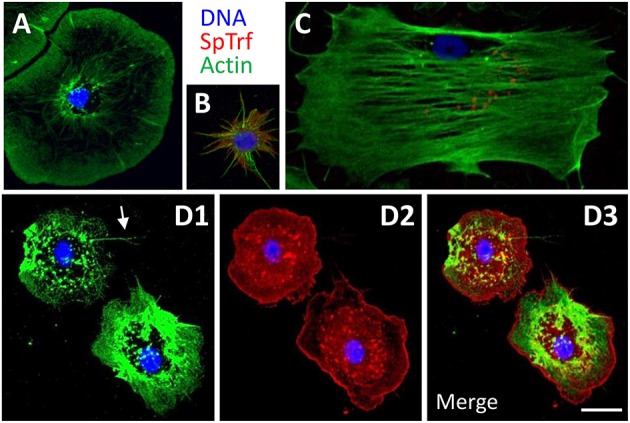
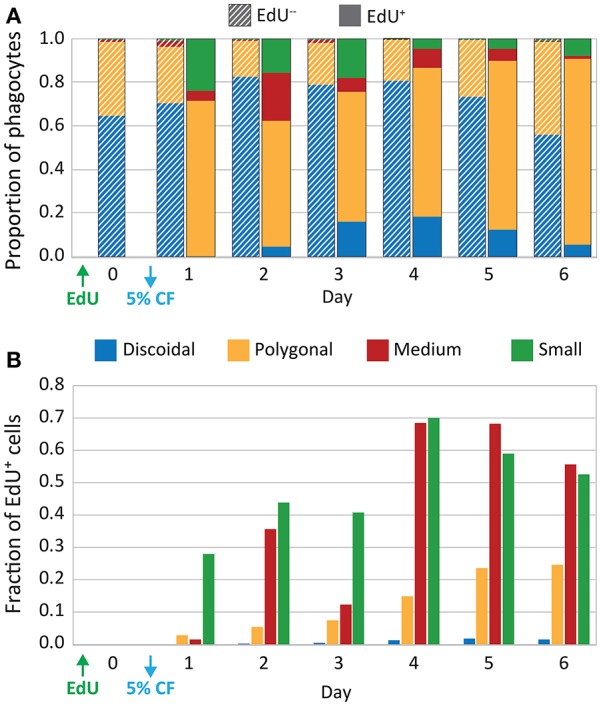
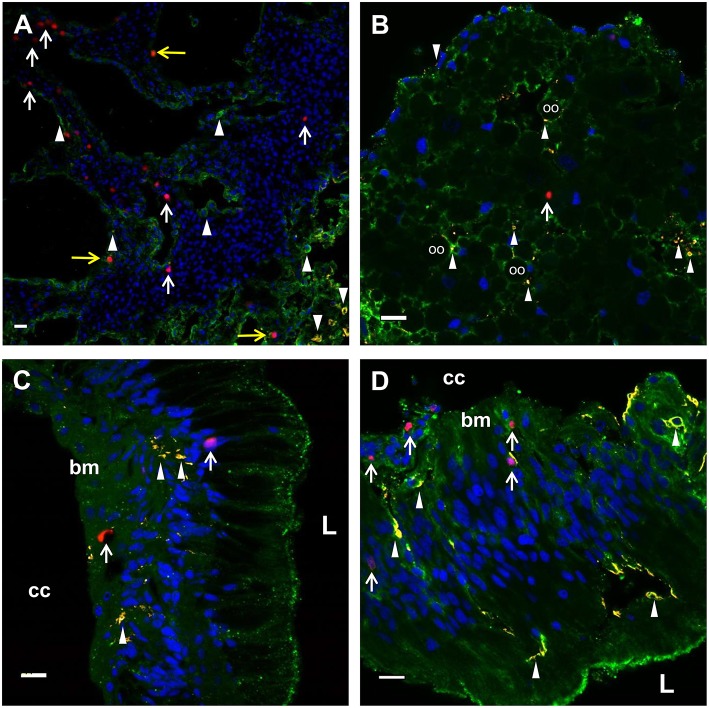
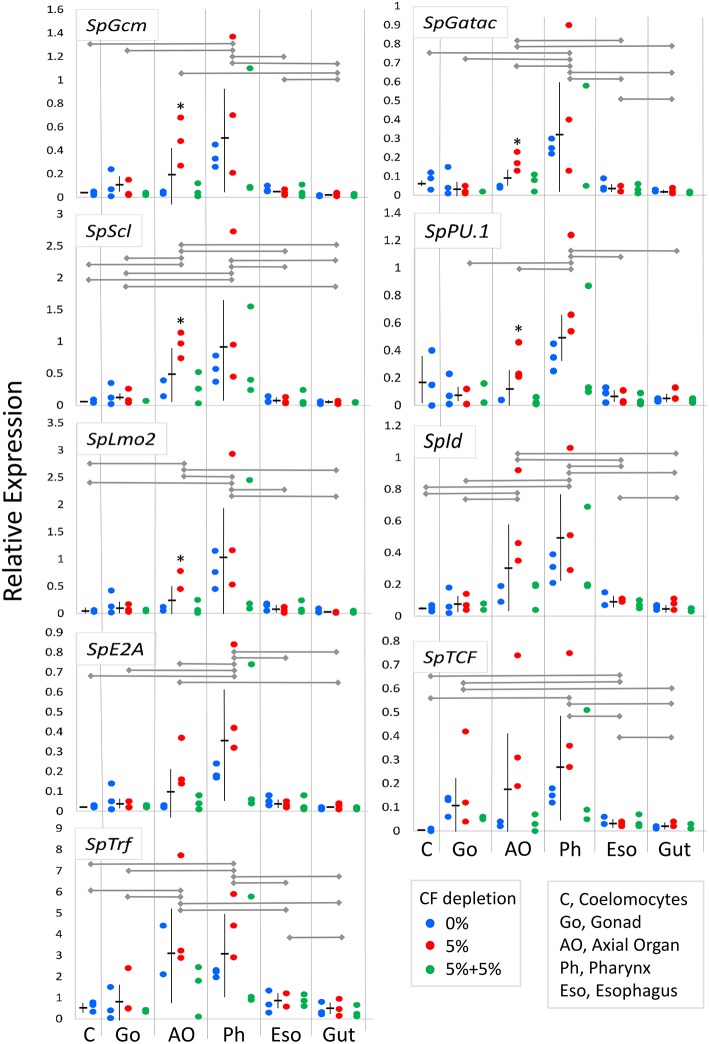
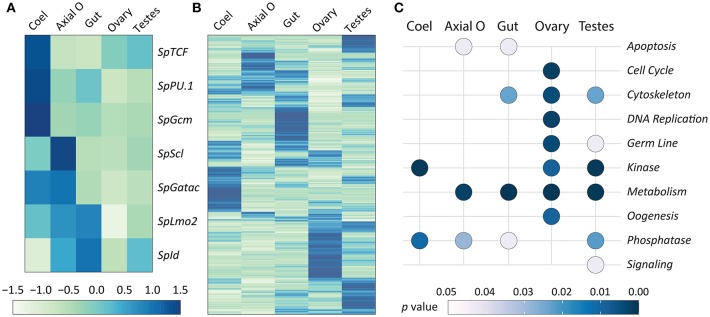
Background: The location of coelomocyte proliferation in adult sea urchins is unknown and speculations since the early 1800s have been based on microanatomy and tracer uptake studies. In adult sea urchins (Strongylocentrotus purpuratus) with down-regulated immune systems, coelomocyte numbers increase in response to immune challenge, and whether some or all of these cells are newly proliferated is not known. The gene regulatory network that encodes transcription factors that control hematopoiesis in embryonic and larval sea urchins has not been investigated in adults. Hence, to identify the hematopoietic tissue in adult sea urchins, cell proliferation, expression of phagocyte specific genes, and expression of genes encoding transcription factors that function in the conserved regulatory network that controls hematopoiesis in embryonic and larval sea urchins were investigated for several tissues. Results: Cell proliferation was induced in adult sea urchins either by immune challenge through injection of heat-killed Vibrio diazotrophicus or by cell depletion through aspiration of coelomic fluid. In response to either of these stimuli, newly proliferated coelomocytes constitute only about 10% of the cells in the coelomic fluid. In tissues, newly proliferated cells and cells that express SpTransformer proteins (formerly Sp185/333) that are markers for phagocytes are present in the axial organ, gonad, pharynx, esophagus, and gut with no differences among tissues. The expression level of genes encoding transcription factors that regulate hematopoiesis show that both the axial organ and the pharynx have elevated expression compared to coelomocytes, esophagus, gut, and gonad. Similarly, an RNAseq dataset shows similar results for the axial organ and pharynx, but also suggests that the axial organ may be a site for removal and recycling of cells in the coelomic cavity. Conclusions: Results presented here are consistent with previous speculations that the axial organ may be a site of coelomocyte proliferation and that it may also be a center for cellular removal and recycling. A second site, the pharynx, may also have hematopoietic activity, a tissue that has been assumed to function only as part of the intestinal tract.

Keywords: EdU; echinoderm; gene regulatory network; hematopoietic tissue; proliferation; transcription factors.


Figures

Figure 1
Figure 1
Increases in coelomocyte concentration and proliferation is induced by Vibrio diazotrophicus and tracked by EdU uptake. (A) EdU injected on day 0 (arrow) is incorporated into the DNA of phagocytes. Animals were also injected on day 0 with either heat-killed Vibrio diazotrophicus or aCF (sham injection). To reduce injury stress, CF was collected on alternating days. EdU incorporation is noted for phagocytes from both groups of sea urchins. (B) The same animals were challenged 54 days after the termination of the experiment shown in (A). They received four injections (arrows) of EdU plus either heat-killed V. diazotrophicus or aCF (sham) and were evaluated for coelomocyte concentration. Animals that received V. diazotrophicus show up to a four-fold increase in coelomocyte concentration compared to the sham injected controls. Differences in cells per ml between groups are significant (*, p < 0.05) on days 5-8. The dashed gray line and gray shading indicate 2.2-fold higher cell concentration relative to day 0. (C) The cells from animals challenged with four injections of either V. diazotrophicus or aCF were evaluated for EdU incorporation. EdU+ cells are present on day 0, which was 75 days after the first injection of EdU given in the experiment shown in (A). Challenge with V. diazotrophicus resulted in coelomocytes with a higher range of EdU+ nuclei than the sham injected controls.
Figure 2
Figure 2
Coelomocyte proliferation is induced by CF depletion. Sea urchins were injected three times with EdU (green arrows) prior to the depletion of 1.5% of the CF (based on estimates of BV) on day 3 (blue arrow). CF was not depleted from the control animals. CF depletion resulted in a significant increase in the percentage of EdU+ coelomocytes on day 4 compared to the controls. Horizontal dashed lines indicate the means for each group. Brackets indicate paired groups with significant differences; *, p < 0.01; ***, p < 0.0001.
Figure 3
Figure 3
The phagocyte class of coelomocytes expresses SpTrf proteins. (A) Discoidal phagocytes have radially arranged actin cables and disc shaped cytoskeletal morphology. They show SpTrf expression rarely (83). (B) Small phagocytes are smaller than the large discoidal and polygonal phagocytes and are typically observed in filopodial morphology. A subset of small phagocytes shows high levels of SpTrf proteins [see also (23)]. (C) Polygonal phagocytes have actin cables that transverse the cell and define the polygonal shape of these cells. Subsets of polygonal phagocytes have SpTrf proteins localized to vesicles that are often positioned in a perinuclear location. (D) Medium phagocytes are defined by their intermediate size, between that of large and small phagocytes, and distinct cytoskeletal morphology of somewhat pentagonal shape with a few thin filopodia (arrow in D1). These cells show high levels of SpTrf proteins throughout the cell (D2, see also Supplementary Figure 2). Scale bar in D3 indicates 10 μm and applies to all figures.
Figure 4
Figure 4
CF depletion induces proliferation of phagocytes. Sea urchins (n = 6) were injected with EdU and 5% of the estimated BV was depleted by CF aspiration. CF was collected from each animal on days 0–6, and phagocytes were processed for immunofluorescence to determine phagocyte type based on size, cytoskeletal morphology, SpTrf expression, and EdU incorporation. The resulting dataset of differential cell counts of 1,000 cells/sample/animal/day was used for the analyses that are displayed in both panels. (A) The EdU phagocyte types show minor variations in the proportions of each cell type over time. Discoidal cells are present at higher levels than polygonal cells and both are present at higher levels than the other phagocyte types. The EdU+ phagocytes show increases in all types of phagocytes, with the most notable increases in the polygonal, medium, and small phagocytes. (B) EdU incorporation for each phagocyte type is shown as the fraction of the total number of cells of each type. Both medium and small phagocyte populations show elevated EdU incorporation.
Figure 5
Figure 5
EdU+ and SpTrf+ cells are present in the axial organ, ovary, esophagus, and gut. (A) A transverse section of the axial organ shows EdU+ cells (white arrows) throughout the tissue. SpTrf+ cells (arrowheads) and EdU+SpTrf+ cells (yellow arrows) are also present. (B) A transverse section of the ovary shows EdU+ cells (arrows) and SpTrf+ cells (arrowheads) dispersed throughout the ovary. SpTrf proteins are also localized along the periphery of the oocytes (oo) as reported previously (29). (C) A longitudinal section of the esophagus shows EdU+ cells (arrows) among the columnar epithelial cells that line the lumen (L) and near the basement membrane (bm) that borders the coelomic cavity (cc). (D) A longitudinal section of the gut shows EdU+ cells (arrows) within the columnar epithelia as well as near the basement membrane (bm) that that faces the coelomic cavity (cc). SpTrf+ cells (arrowheads) are dispersed throughout the columnar epithelium, as reported previously (29). Sections are stained for DNA (DAPI, blue), actin (green), EdU (red), and SpTrf (yellow). See Supplementary Figure 3 for images of these sections prior to merging. Scale bars indicate 10 μm.
Figure 6
Figure 6
Expression of genes encoding transcription factors that regulate hematopoiesis are elevated in the axial organ and the pharynx. Expression of genes encoding hematopoiesis transcription factors in tissues and coelomocytes relative to the expression of SpL8 that encodes a homolog of the large ribosomal protein L8 was based on qPCR results. Data from groups of animals from which CF was depleted (0%, 5% once or twice) were combined and compared between tissues by unpaired t-test and indicate that gene expression is highest in the pharynx with similar or somewhat lower expression in the axial organ. In some cases, gene expression in individual tissues shows significant increases in animals from which 5% CF was depleted (*) (see Supplementary Table 5). Expression of the SpTrf genes, which are markers for phagocytes, is highest in the axial organ and the pharynx. Horizontal gray lines for each gene indicate significant differences in gene expression between tissues (p < 0.05) based on unpaired t-tests (Supplementary Table 6) or a Bonferroni post-test after two-factor, non-parametric ANOVA (Supplementary Table 8). Mean expression ± standard deviation are shown in horizontal and vertical black lines for each tissue.
Figure 7
Figure 7
Expression of genes encoding transcription factors that control hematopoiesis are elevated in the axial organ and coelomocytes. The RNAseq dataset for adult sea urchin tissues (72) was used to analyze gene expression. Tissues were isolated from sea urchins that were not immune challenged. The pharynx was not included in the original dataset. (A) Differential expression levels of genes encoding transcription factors that function in the hematopoiesis GRN, based on results from embryos and larvae, were selected from the RNAseq dataset. Results show that different transcription factors may function in coelomocytes (Coel) compared to the axial organ (Axial O). Expression is generally lower in ovary and testes. (B) Differential expression of all genes is indicated for each tissue, which is based on read counts per transcript matching to the genome. The different tissues tend to express different sets of genes. Elevated gene expression is indicated in (A,B) by darker blue colors and diminished expression is in lighter shades of green. (C) Gene expression for the tissues is shown relative to predicted functions based on gene ontology (see Table 1 and Data Sheet 1). Significant association with function (p ≤ 0.05) is indicated by light gray, whereas all darker blue shades indicate non-significant association.

Similar articles

Cited by

References

    1. Rieger MA, Schroeder T. Hematopoiesis. Cold Spring Harbor Persp Biol. (2012) 4:a008250 10.1101/cshperspect.a008250 - DOI - PMC - PubMed
    1. Jagannathan-Bogdan M, Zon LI. Hematopoiesis. Development. (2013) 140:2463–7. 10.1242/dev.083147 - DOI - PMC - PubMed
    1. Labreuche Y, Lambert C, Soudant P, Boulo V, Huvet A, Nicolas JL. Cellular and molecular hemocyte responses of the Pacific oyster, Crassostrea gigas, following bacterial infection with Vibrio aestuarianus strain 01/32. Microbes Infect. (2006) 8:2715–24. 10.1016/j.micinf.2006.07.020 - DOI - PubMed
    1. Soderhall I, Bangyeekhun E, Mayo S, Soderhall K. Hemocyte production and maturation in an invertebrate animal; proliferation and gene expression in hematopoietic stem cells of Pacifasticus lenisculus. Dev Comp Immunol. (2003) 24:661–72. 10.1016/S0145-305X(03)00039-9 - DOI - PubMed
    1. Sequiera T, Tavares D, Arala-Chaves M. Evidence for circulating hemocyte proliferation in the shrimp Penaeus japonicas. Dev Comp Immunol. (1996) 20:97–104. 10.1016/0145-305X(96)00001-8 - DOI - PubMed

Publication types

Substances

LinkOut - more resources