

An Animal Model of Acute and Chronic Chagas Disease With the Reticulotropic Y Strain of Trypanosoma cruzi That Depicts the Multifunctionality and Dysfunctionality of T Cells
- PMID: 31105709
- PMCID: PMC6499084
- DOI: 10.3389/fimmu.2019.00918
An Animal Model of Acute and Chronic Chagas Disease With the Reticulotropic Y Strain of Trypanosoma cruzi That Depicts the Multifunctionality and Dysfunctionality of T Cells
Abstract
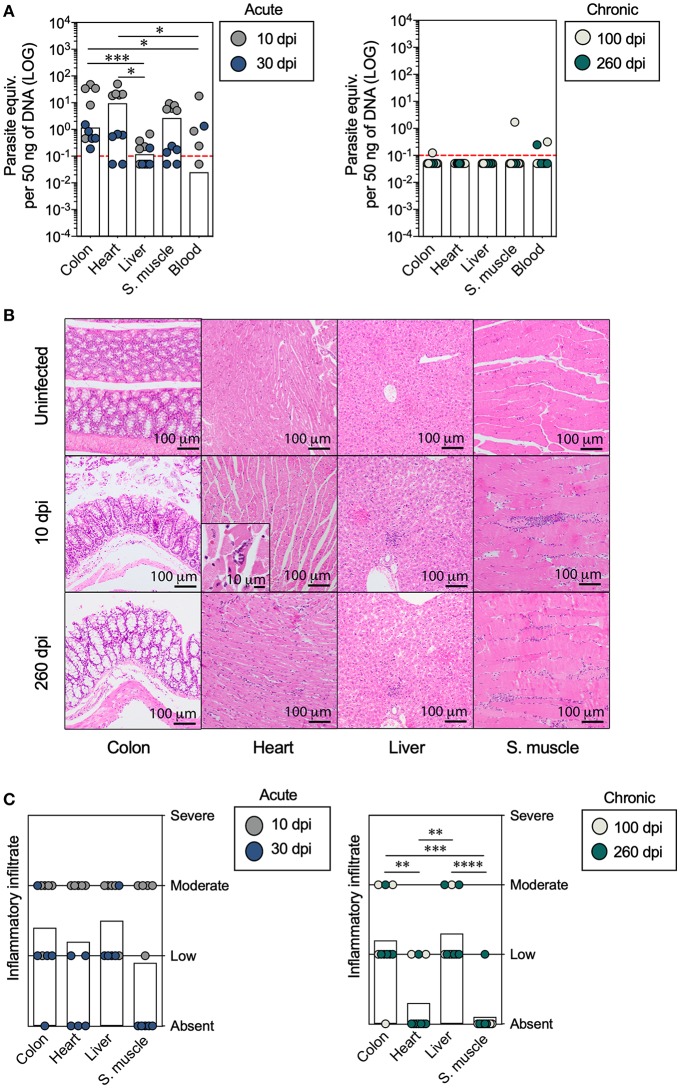
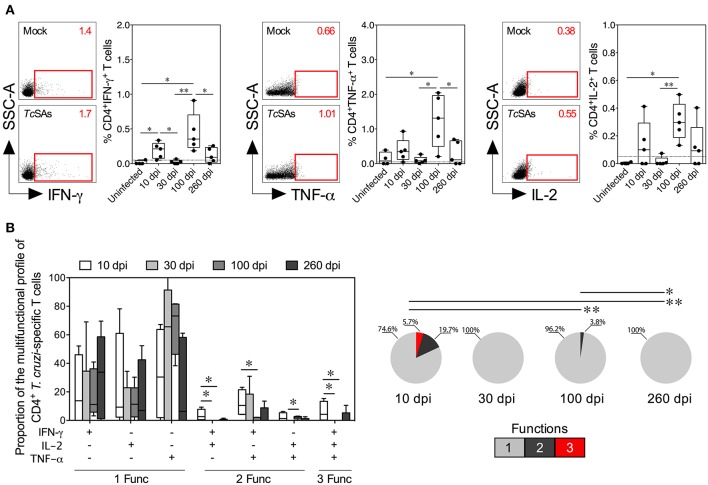
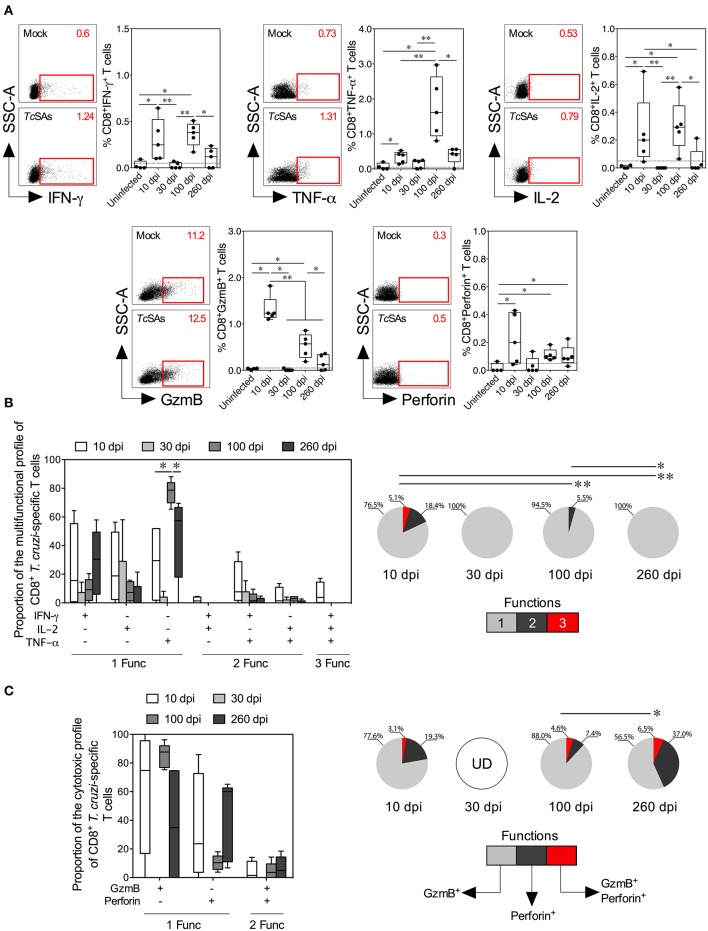
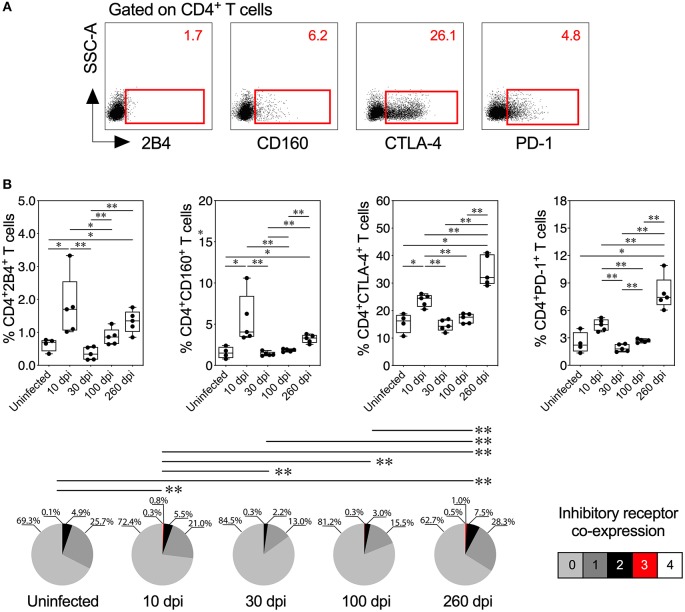
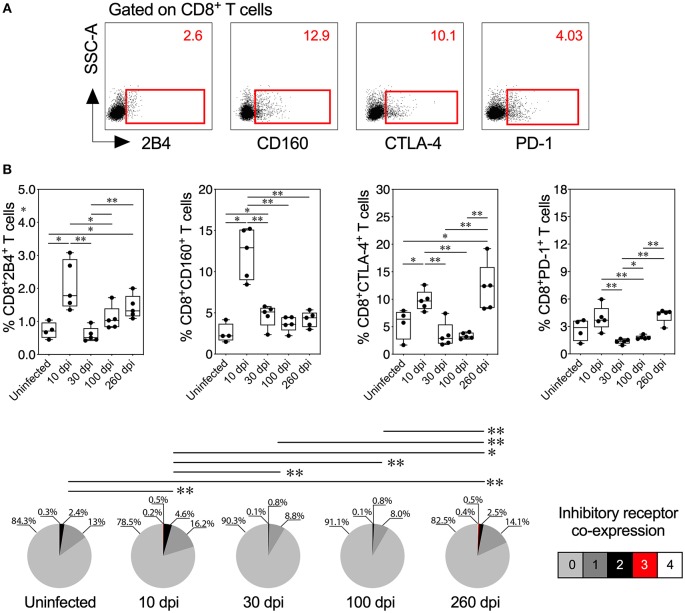
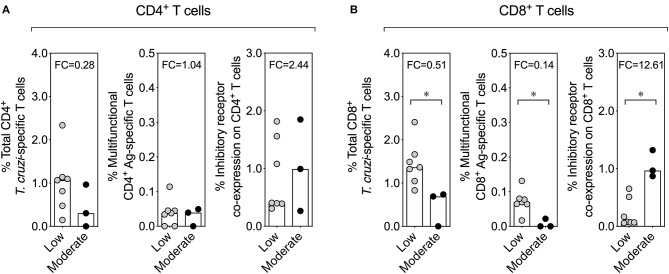
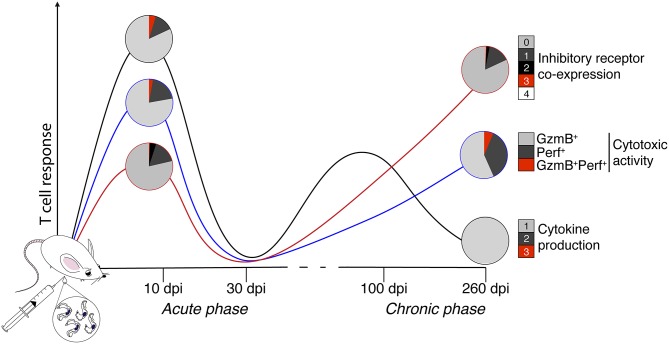
Chagas disease (ChD), a complex and persistent parasitosis caused by Trypanosoma cruzi, represents a natural model of chronic infection, in which some people exhibit cardiac or digestive complications that can result in death 20-40 years after the initial infection. Nonetheless, due to unknown mechanisms, some T. cruzi-infected individuals remain asymptomatic throughout their lives. Actually, no vaccine is available to prevent ChD, and treatments for chronic ChD patients are controversial. Chronically T. cruzi-infected individuals exhibit a deterioration of T cell function, an exhaustion state characterized by poor cytokine production and increased inhibitory receptor co-expression, suggesting that these changes are potentially related to ChD progression. Moreover, an effective anti-parasitic treatment appears to reverse this state and improve the T cell response. Taking into account these findings, the functionality state of T cells might provide a potential correlate of protection to detect individuals who will or will not develop the severe forms of ChD. Consequently, we investigated the T cell response, analyzed by flow cytometry with two multicolor immunofluorescence panels, to assess cytokines/cytotoxic molecules and the expression of inhibitory receptors, in a murine model of acute (10 and 30 days) and chronic (100 and 260 days) ChD, characterized by parasite persistence for up to 260 days post-infection and moderate inflammation of the colon and liver of T. cruzi-infected mice. Acute ChD induced a high antigen-specific multifunctional T cell response by producing IFN-γ, TNF-α, IL-2, granzyme B, and perforin; and a high frequency of T cells co-expressed 2B4, CD160, CTLA-4, and PD-1. In contrast, chronically infected mice with moderate inflammatory infiltrate in liver tissue exhibited monofunctional antigen-specific cells, high cytotoxic activity (granzyme B and perforin), and elevated levels of inhibitory receptors (predominantly CTLA-4 and PD-1) co-expressed on T cells. Taken together, these data support our previous results showing that similar to humans, the T. cruzi persistence in mice promotes the dysfunctionality of T cells, and these changes might correlate with ChD progression. Thus, these results constitute a model that will facilitate an in-depth search for immune markers and correlates of protection, as well as long-term studies of new immunotherapy strategies for ChD.
Keywords: Chagas disease; T cell response; clonal exhaustion; immune activation; inhibitory receptors; multifunctionality.
Figures
Similar articles
-
Inhibitory receptors are expressed by Trypanosoma cruzi-specific effector T cells and in hearts of subjects with chronic Chagas disease.PLoS One. 2012;7(5):e35966. doi: 10.1371/journal.pone.0035966. Epub 2012 May 4. PLoS One. 2012. PMID: 22574131 Free PMC article.
-
Impact of benznidazole treatment on the functional response of Trypanosoma cruzi antigen-specific CD4+CD8+ T cells in chronic Chagas disease patients.PLoS Negl Trop Dis. 2018 May 11;12(5):e0006480. doi: 10.1371/journal.pntd.0006480. eCollection 2018 May. PLoS Negl Trop Dis. 2018. PMID: 29750791 Free PMC article.
-
Programmed Cell Death Protein 1-PDL1 Interaction Prevents Heart Damage in Chronic Trypanosoma cruzi Infection.Front Immunol. 2018 May 7;9:997. doi: 10.3389/fimmu.2018.00997. eCollection 2018. Front Immunol. 2018. PMID: 29867974 Free PMC article.
-
Trypanosoma cruzi-specific CD8+ T cells and other immunological hallmarks in chronic Chagas cardiomyopathy: Two decades of research.Front Cell Infect Microbiol. 2023 Jan 4;12:1075717. doi: 10.3389/fcimb.2022.1075717. eCollection 2022. Front Cell Infect Microbiol. 2023. PMID: 36683674 Free PMC article. Review.
-
[Role of cytokines in resistance and pathology in Trypanosoma cruzi infection].Rev Argent Microbiol. 1996 Apr-Jun;28(2):99-109. Rev Argent Microbiol. 1996. PMID: 8768488 Review. Spanish.
Cited by
-
Main Cardiac Histopathologic Alterations in the Acute Phase of Trypanosoma cruzi Infection in a Murine Model.Pathogens. 2023 Aug 26;12(9):1084. doi: 10.3390/pathogens12091084. Pathogens. 2023. PMID: 37764892 Free PMC article.
-
CD39 expression by regulatory T cells participates in CD8+ T cell suppression during experimental Trypanosoma cruzi infection.PLoS Pathog. 2024 Apr 29;20(4):e1012191. doi: 10.1371/journal.ppat.1012191. eCollection 2024 Apr. PLoS Pathog. 2024. PMID: 38683845 Free PMC article.
-
The Functions of Cytokines in the Cardiac Immunopathogenesis of Chagas Disease.Pathogens. 2024 Oct 3;13(10):870. doi: 10.3390/pathogens13100870. Pathogens. 2024. PMID: 39452741 Free PMC article. Review.
-
Exhausted PD-1+ TOX+ CD8+ T Cells Arise Only in Long-Term Experimental Trypanosoma cruzi Infection.Front Immunol. 2022 Jun 3;13:866179. doi: 10.3389/fimmu.2022.866179. eCollection 2022. Front Immunol. 2022. PMID: 35720419 Free PMC article.
-
Antimicrobial activity of NK cells to Trypanosoma cruzi infected human primary Keratinocytes.PLoS Negl Trop Dis. 2024 Jul 22;18(7):e0012255. doi: 10.1371/journal.pntd.0012255. eCollection 2024 Jul. PLoS Negl Trop Dis. 2024. PMID: 39038032 Free PMC article.
References
-
- Yaeger RG. Chapter 77, Protozoa: structure, classification, growth, and development. In: Baron S. editor. Medical Microbiology, Galveston, TX: University of Texas Medical Branch; (1996). Available online at: https://www.ncbi.nlm.nih.gov/books/NBK8325/ - PubMed
Publication types
MeSH terms
Substances
LinkOut - more resources
Full Text Sources
Medical