. 2019 Apr 24:10:359.
doi: 10.3389/fgene.2019.00359. eCollection 2019.

Assortative Mating on Ancestry-Variant Traits in Admixed Latin American Populations

Affiliations

Assortative Mating on Ancestry-Variant Traits in Admixed Latin American Populations

Emily T Norris et al. Front Genet. .

Abstract

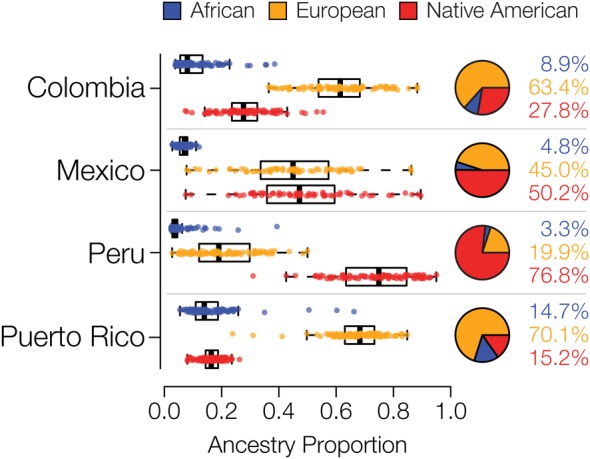
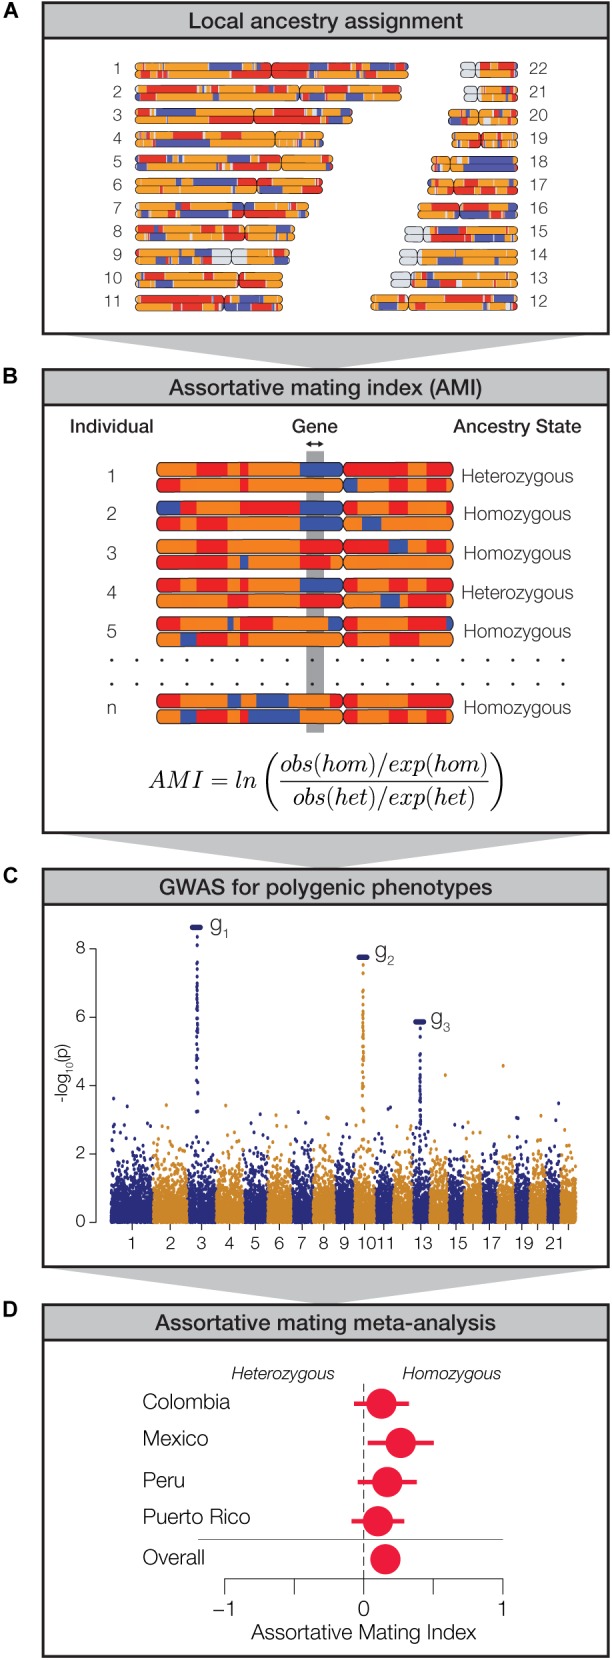
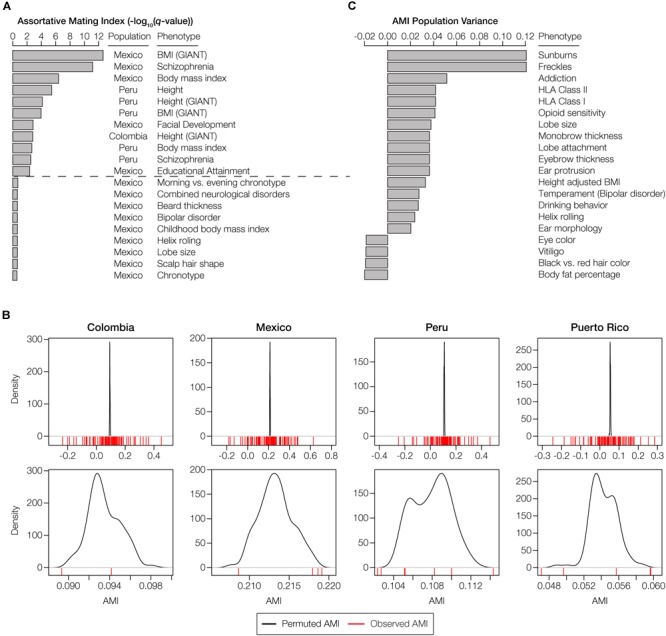
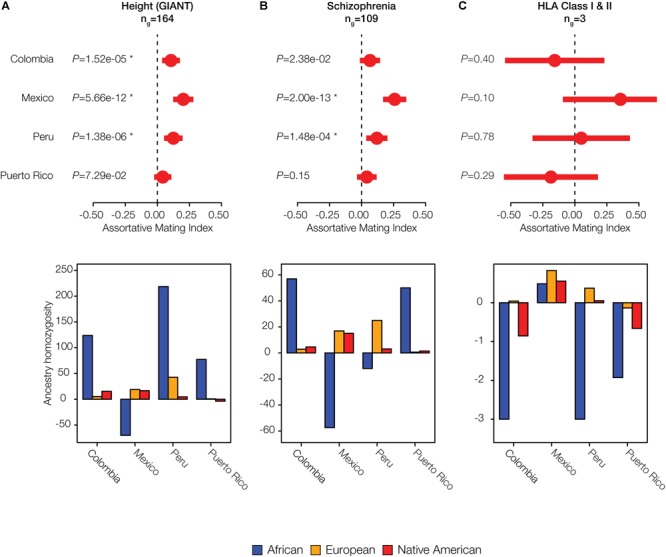
Assortative mating is a universal feature of human societies, and individuals from ethnically diverse populations are known to mate assortatively based on similarities in genetic ancestry. However, little is currently known regarding the exact phenotypic cues, or their underlying genetic architecture, which inform ancestry-based assortative mating. We developed a novel approach, using genome-wide analysis of ancestry-specific haplotypes, to evaluate ancestry-based assortative mating on traits whose expression varies among the three continental population groups - African, European, and Native American - that admixed to form modern Latin American populations. Application of this method to genome sequences sampled from Colombia, Mexico, Peru, and Puerto Rico revealed widespread ancestry-based assortative mating. We discovered a number of anthropometric traits (body mass, height, and facial development) and neurological attributes (educational attainment and schizophrenia) that serve as phenotypic cues for ancestry-based assortative mating. Major histocompatibility complex (MHC) loci show population-specific patterns of both assortative and disassortative mating in Latin America. Ancestry-based assortative mating in the populations analyzed here appears to be driven primarily by African ancestry. This study serves as an example of how population genomic analyses can yield novel insights into human behavior.

Keywords: admixture; assortative mating; genetic ancestry; mate choice; polygenic phenotypes; population genomics.


Figures

FIGURE 1
FIGURE 1
Genetic ancestry proportions for the admixed Latin American populations studied here. For each population, distributions and average values are shown for African (blue), European (orange), and Native American (red) ancestry.
FIGURE 2
FIGURE 2
Approach used to measure assortative mating on local ancestry. (A) Local ancestry is assigned for specific haplotypes across the genome: African (blue), European (orange), and Native American (red). (B) Within individual genomes, genes are characterized as homozygous or heterozygous for local ancestry. For any given population, at each gene locus, the assortative mating index (AMI) is computed from the observed and expected counts of homozygous and heterozygous gene pairs. (C) Data from genome-wide association studies (GWAS) are used to evaluate polygenic phenotypes. (D) Meta-analysis of AMI values is used to evaluate the significance of ancestry-based assortative mating for polygenic phenotypes.
FIGURE 3
FIGURE 3
Overview of ancestry-based assortative mating in the four admixed Latin American populations analyzed here. (A) Distributions of observed and expected AMI values for all four populations. Inset: Mean observed and expected AMI values (±se) for all four populations. Significance between mean observed and expected AMI values (P = 8.12e-56) is indicated by two asterisks. (B) Observed and expected average AMI values (±se) across all polygenic phenotype gene sets are shown for each population. (C) Average AMI values (±se) for each population are shown for the three main phenotype functional categories characterized here: anthropometric, neurological, and human leukocyte antigen (HLA) genes.
FIGURE 4
FIGURE 4
Phenotypes with statistically significant patterns of assortative mating within and among populations. (A) The top 20 phenotypes with the highest, and most statistically significant, assortative mating values (AMI) seen within any individual population. All AMI values shown are significant at P < 0.05, and the dashed line corresponds to a false discovery rate q-value cutoff of 0.05. (B) The observed AMI values for all trait-specific gene sets in each population (red lines) are compared to distributions of expected AMI values (black lines) based on random permutations of 10,000 gene sets. The top panels show the overall distributions of observed and permuted AMI values for each population, with steep peaks around the mean values for expected AMI. The bottom panels show a more narrow range of observed and expected AMI values for each population, which are centered around the population-specific mean expected AMI values. (C) The top 20 phenotypes with the highest or lowest, and most statistically significant, AMI variance levels across populations. Across population variance levels are normalized using the average AMI population variance level for all phenotypes. All AMI variance levels shown are significant at q < 0.05. The highest variance (most dissimilar patterns) of the AMI are at the top, while the lowest variance (most similar patterns) of AMI are at the bottom.
FIGURE 5
FIGURE 5
Individual examples of ancestry-based assortative and disassortative mating. Results of meta-analysis of (dis)assortative mating on polygenic phenotypes along with their ancestry drivers are shown for (A) an anthropometric trait: Height, (B) a neurological trait: Schizophrenia, and (C) the immune-related HLA class I and II genes. The meta-analysis plots show pooled AMI odds ratio values along with their 95% CIs and P-values. Stars indicate false discovery rate q-values < 0.05. The ancestry driver plots show the extent to which individual ancestry components – African (blue), European (orange), and Native American (red) – have an excess (>0) or a deficit (<0) of homozygosity.
FIGURE 6
FIGURE 6
Inter-individual ancestry variance for the four admixed Latin American populations analyzed here. Variance among individuals for the African (blue), European (orange), and Native American (red) ancestry fractions within each population are shown.

References

    1. Abdellaoui A., Verweij K. J., Zietsch B. P. (2014). No evidence for genetic assortative mating beyond that due to population stratification. Proc. Natl. Acad. Sci. U.S.A. 111:E4137. 10.1073/pnas.1410781111 - DOI - PMC - PubMed
    1. Alexander D. H., Novembre J., Lange K. (2009). Fast model-based estimation of ancestry in unrelated individuals. Genome Res. 19 1655–1664. 10.1101/gr.094052.109 - DOI - PMC - PubMed
    1. Allison D. B., Neale M. C., Kezis M. I., Alfonso V. C., Heshka S., Heymsfield S. B. (1996). Assortative mating for relative weight: genetic implications. Behav. Genet. 26 103–111. 10.1007/bf02359888 - DOI - PubMed
    1. Bryc K., Velez C., Karafet T., Moreno-Estrada A., Reynolds A., Auton A., et al. (2010). Colloquium paper: genome-wide patterns of population structure and admixture among Hispanic/Latino populations. Proc. Natl. Acad. Sci. U.S.A. 107(Suppl. 2) 8954–8961. 10.1073/pnas.0914618107 - DOI - PMC - PubMed
    1. Buss D. M. (1985). Human mate selection: opposites are sometimes said to attract, but in fact we are likely to marry someone who is similar to us in almost every variable. Am. Sci. 73 47–51.