

The change tendency of endoplasmic reticulum stress associated proteins in rats with spinal cord injury
- PMID: 31105809
- PMCID: PMC6511803
The change tendency of endoplasmic reticulum stress associated proteins in rats with spinal cord injury
Abstract
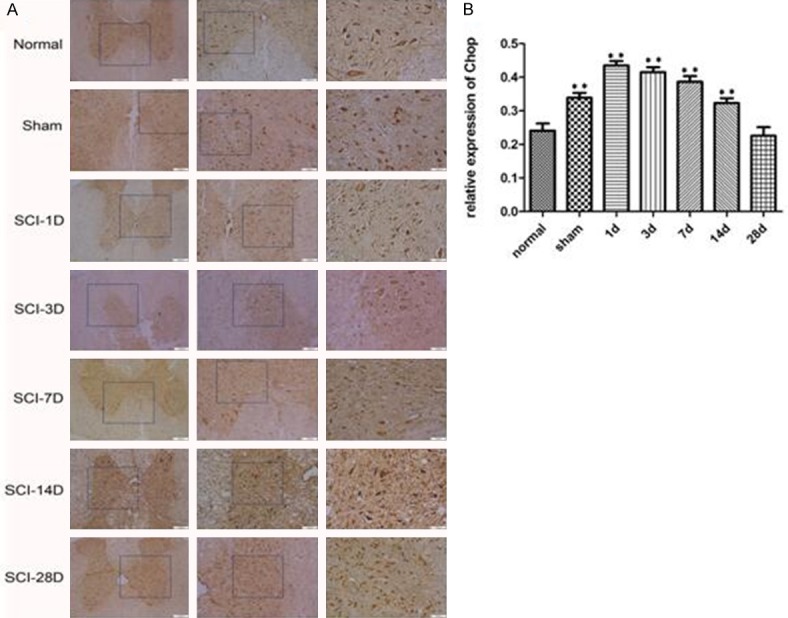
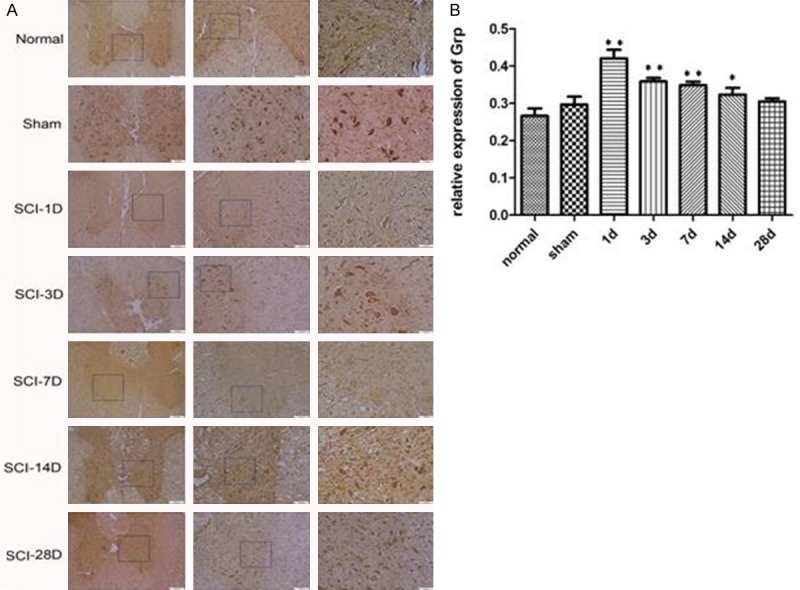
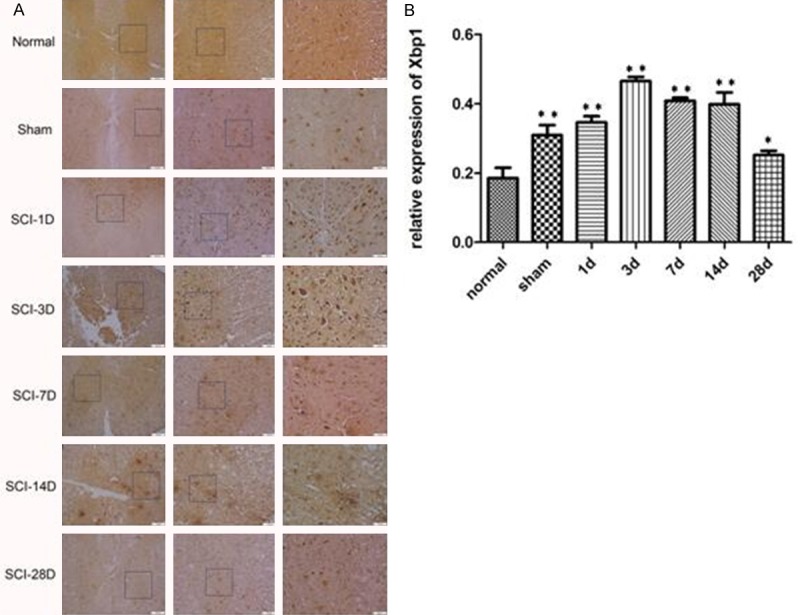
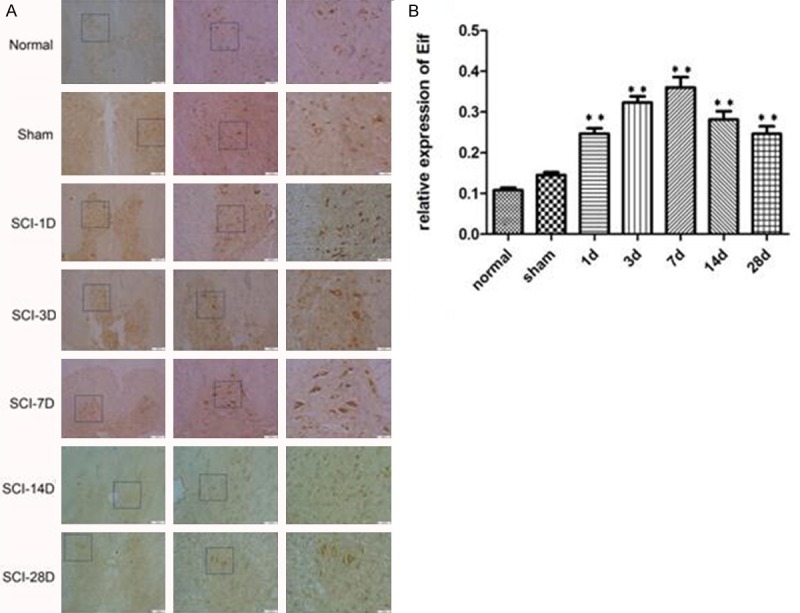
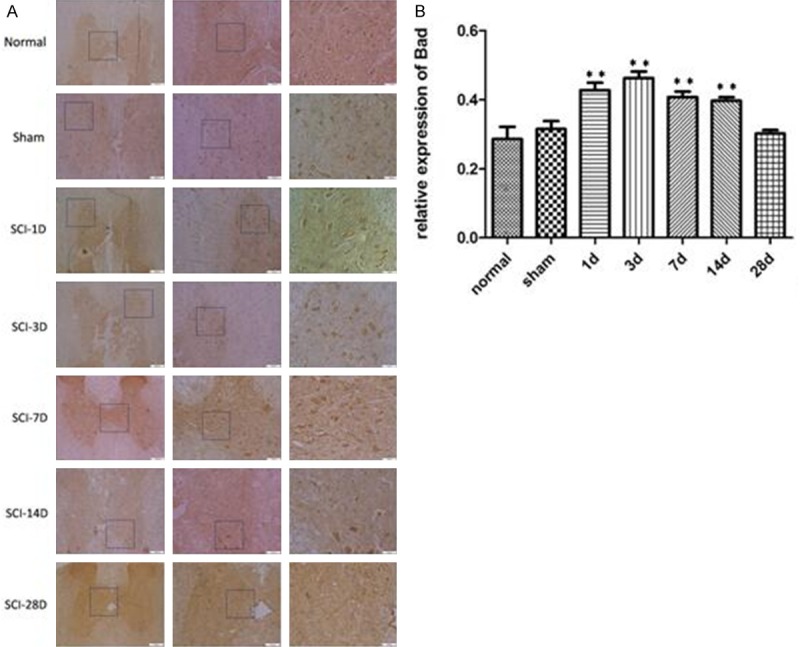
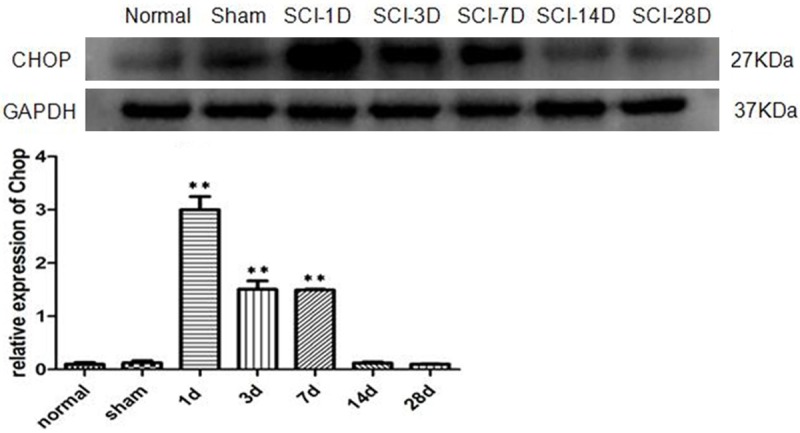
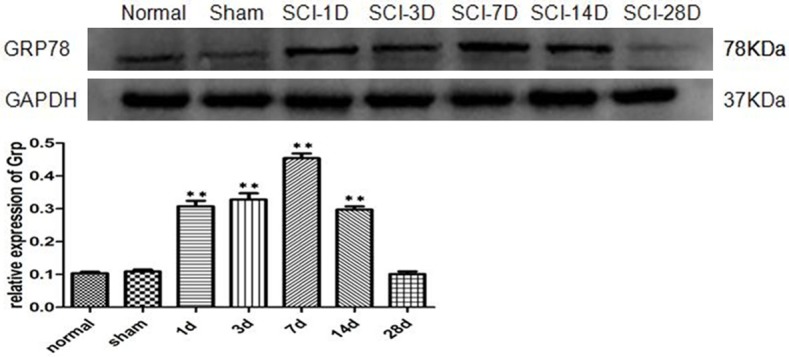
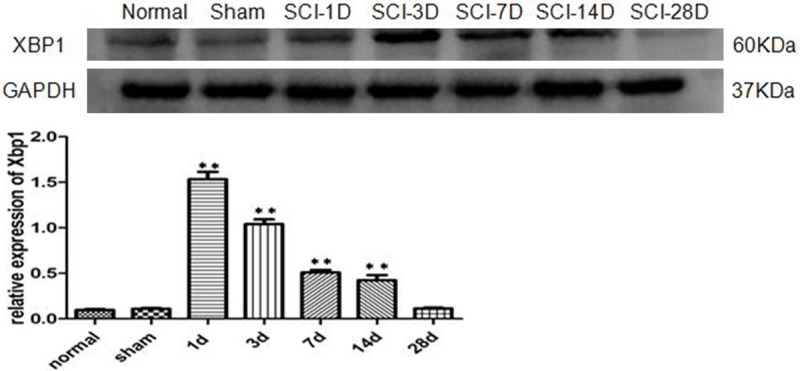
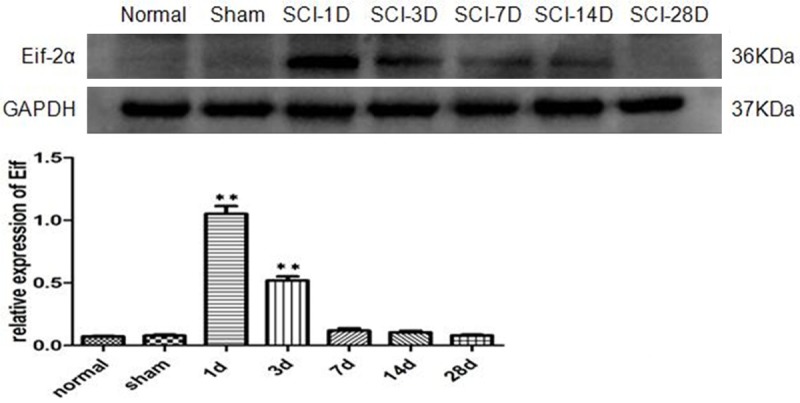
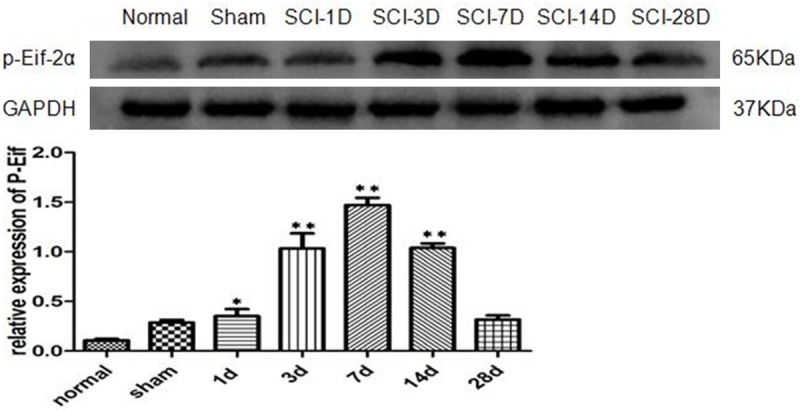
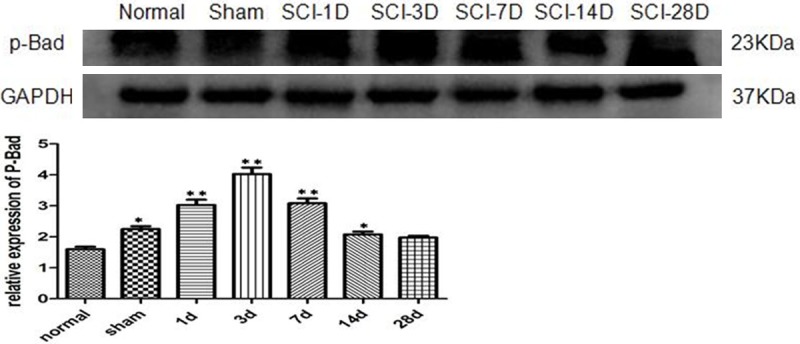
To investigate endoplasmic reticulum (ER) stress reactions in spinal cord injury rats by evaluating the expression of the glucose-regulated protein 78 (GRP78), C/EBP homologous transcription factor protein (CHOP), X-box binding protein 1 (XBP1), Eif-2α and Bad. SCI models were established using adult female mice. After SCI, the expression of endoplasmic reticulum stress-induced apoptosis proteins were examined in the mice at specific time points using immunohistochemistry and western blot. The results of immunohistochemistry showed that in spinal cord gray matter, Chop, Grp78, XBP1, Eif-2α and Bad were specifically detected in the cytoplasm of the cell. Compare with the SCI group, there was little expression in normal group and sham group. The expression of ER stress-induced apoptosis proteins were significantly increased after spinal cord injury, and the absolute expression was higher than normal group (P < 0.05). Western-Blot results showed that compare with the SCI group, there were little expression of ER stress-induced apoptosis proteins in normal group and sham group. The expression of ER stress-induced apoptosis proteins were significantly increased after spinal cord injury, and the absolute expression was higher than normal group (P < 0.05). These results suggest that some ER stress-induced apoptosis proteins, such as Chop, Grp78, XBP1, Eif-2α and Bad, were activated after spinal cord injury, but the precise regulatory mechanisms remain unclear. In the future, understanding of the precise mechanism of ER stress-mediated apoptosis in SCI may lead to the development of novel treatment strategies.
Keywords: Chop; Eif-2α; Grp78; Spinal cord injury; endoplasmic reticulum stress-induced apoptosis.
Conflict of interest statement
None.
Figures

Similar articles
-
Fibroblast Growth Factor 22 Inhibits ER Stress-Induced Apoptosis and Improves Recovery of Spinal Cord Injury.Front Pharmacol. 2020 Feb 11;11:18. doi: 10.3389/fphar.2020.00018. eCollection 2020. Front Pharmacol. 2020. PMID: 32116697 Free PMC article.
-
[Effects of electroacupuncture at "Jiaji"(EX-B2) on autophagy and endoplasmic reticulum stress in spinal cord injury mice].Zhen Ci Yan Jiu. 2021 Jan 25;46(1):45-51. doi: 10.13702/j.1000-0607.200229. Zhen Ci Yan Jiu. 2021. PMID: 33559425 Chinese.
-
Endoplasmic reticulum stress response in the rat contusive spinal cord injury model-susceptibility in specific cell types.Spinal Cord. 2014 Jan;52(1):9-16. doi: 10.1038/sc.2013.118. Epub 2013 Oct 22. Spinal Cord. 2014. PMID: 24145689
-
Icariin Inhibits Endoplasmic Reticulum Stress-induced Neuronal Apoptosis after Spinal Cord Injury through Modulating the PI3K/AKT Signaling Pathway.Int J Biol Sci. 2019 Jan 1;15(2):277-286. doi: 10.7150/ijbs.30348. eCollection 2019. Int J Biol Sci. 2019. PMID: 30745820 Free PMC article.
-
Administration of the GLP-1 receptor agonist exenatide in rats improves functional recovery after spinal cord injury by reducing endoplasmic reticulum stress.IBRO Neurosci Rep. 2023 Sep 11;15:225-234. doi: 10.1016/j.ibneur.2023.09.003. eCollection 2023 Dec. IBRO Neurosci Rep. 2023. PMID: 37822517 Free PMC article.
Cited by
-
Catalpol as a Component of Rehmannia glutinosa Protects Spinal Cord Injury by Inhibiting Endoplasmic Reticulum Stress-Mediated Neuronal Apoptosis.Front Pharmacol. 2022 Jul 8;13:860757. doi: 10.3389/fphar.2022.860757. eCollection 2022. Front Pharmacol. 2022. PMID: 35873542 Free PMC article.
-
Endoplasmic Reticulum Stress Causing Apoptosis in a Mouse Model of an Ischemic Spinal Cord Injury.Int J Mol Sci. 2023 Jan 9;24(2):1307. doi: 10.3390/ijms24021307. Int J Mol Sci. 2023. PMID: 36674822 Free PMC article.
-
circ_014260/miR-384/THBS1 aggravates spinal cord injury in rats by promoting neuronal apoptosis and endoplasmic reticulum stress.Am J Transl Res. 2022 Jan 15;14(1):518-533. eCollection 2022. Am J Transl Res. 2022. PMID: 35173872 Free PMC article.
References
-
- Tian T, Yu Z, Zhang N, Chang Y, Zhang Y, Zhang L, Zhou S, Zhang C, Feng G, Huang F. Modified acellular nerve-delivering PMSCs improve functional recovery in rats after complete spinal cord transection. Biomater Sci. 2017;5:2480–2492. - PubMed
-
- Zhang Y, Hu H, Tian T, Zhang L, Zhao D, Wu Q, Chang Y, Wang Q, Zhou S, Feng G, Huang F. Mst3b promotes spinal cord neuronal regeneration by promoting growth cone branching out in spinal cord injury rats. Mol Neurobiol. 2015;51:1144–1157. - PubMed
-
- Wang J, Li H, Ren Y, Yao Y, Hu J, Zheng M, Ding Y, Chen YY, Shen Y, Wang LL, Zhu Y. Local delivery of beta-elemene improves locomotor functional recovery by alleviating endoplasmic reticulum stress and reducing neuronal apoptosis in rats with spinal cord injury. Cell Physiol Biochem. 2018;49:595–609. - PubMed
LinkOut - more resources
Full Text Sources
Research Materials
Miscellaneous