. 2019 Apr 12;10(28):2693-2708.
doi: 10.18632/oncotarget.26857.

Genomic landscape analyses of reprogrammed cells using integrative and non-integrative methods reveal variable cancer-associated alterations

Affiliations

Genomic landscape analyses of reprogrammed cells using integrative and non-integrative methods reveal variable cancer-associated alterations

Frank Griscelli et al. Oncotarget. .

Abstract

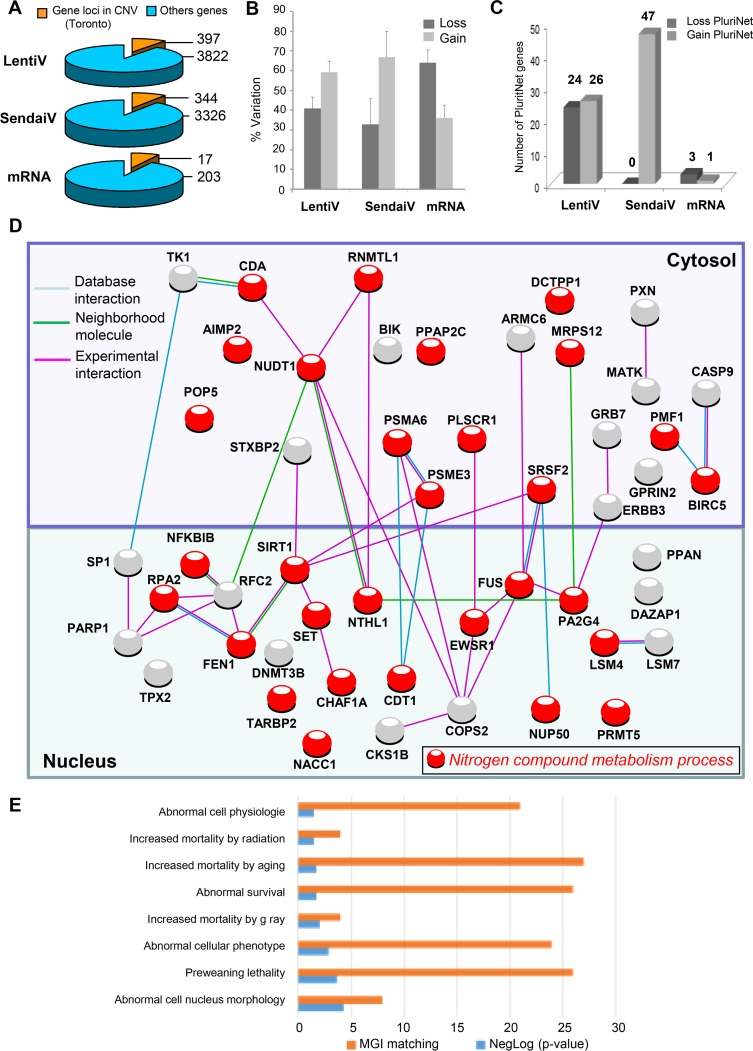
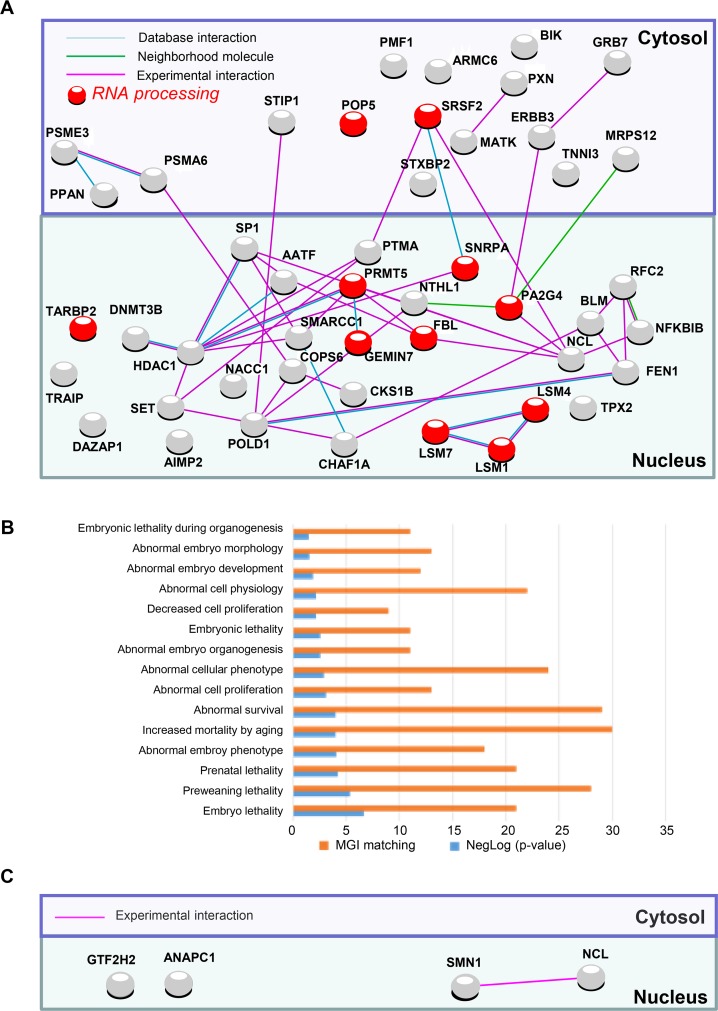
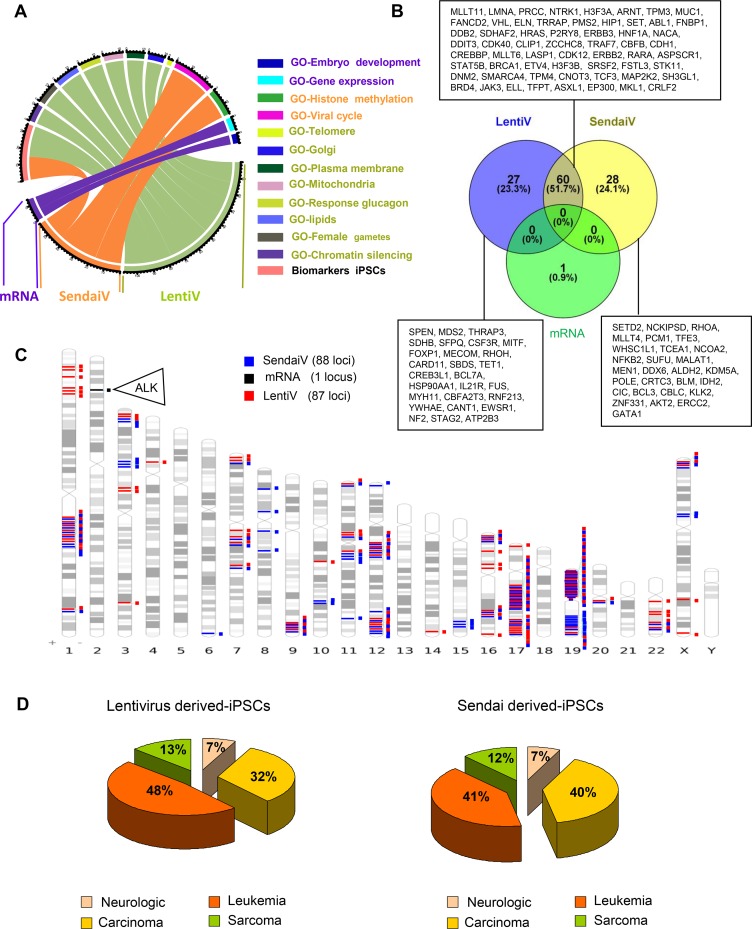
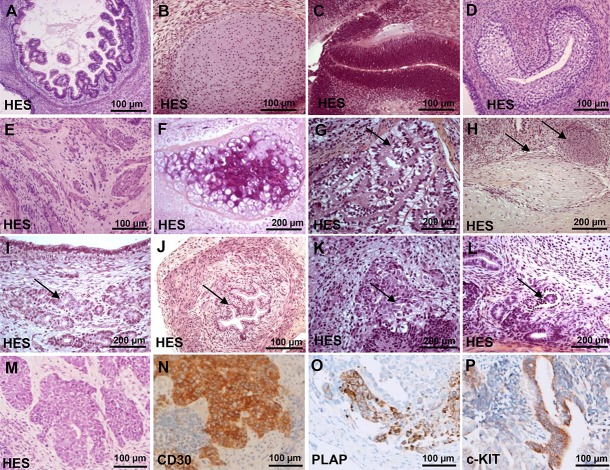
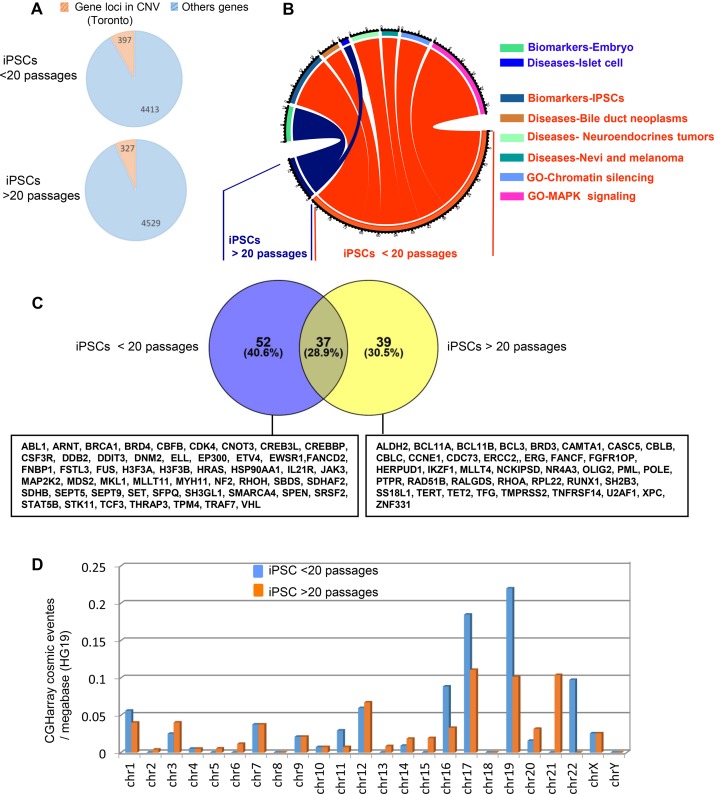
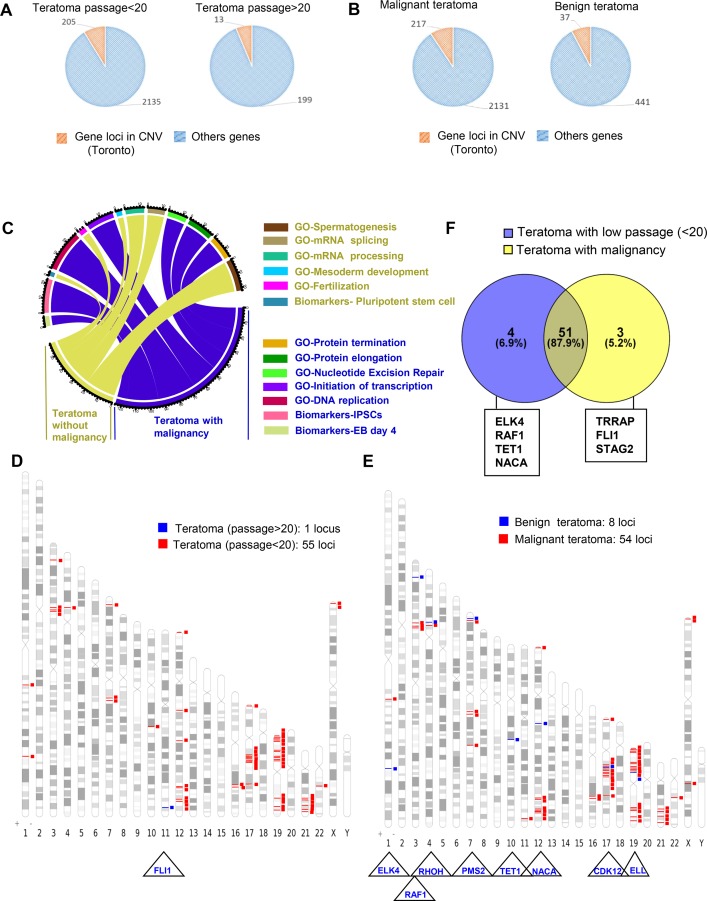
Recent development of cell reprogramming technologies brought a major hope for future cell therapy applications by the use of these cells or their derivatives. For this purpose, one of the major requirements is the absence of genomic alterations generating a risk of cell transformation. Here we analyzed by microarray-based comparative genomic hybridization human iPSC generated by two non-integrative and one integrative method at pluripotent stage as well as in corresponding teratomas. We show that all iPSC lines exhibit copy number variations (CNV) of several genes deregulated in oncogenesis. These cancer-associated genomic alterations were more pronounced in virally programmed hiPSCs and their derivative teratoma as compared to those found in iPSC generated by mRNA-mediated reprogramming. Bioinformatics analysis showed the involvement of these genes in human leukemia and carcinoma. We conclude that genetic screening should become a standard procedure to ensure that hiPSCs are free from cancer-associated genomic alterations before clinical use.

Keywords: CGH array; genetic instability; iPSCs.


Conflict of interest statement

CONFLICTS OF INTEREST There are no conflicts of interest to disclose.

Figures

Figure 1
Figure 1. PluriNet and Mammalian phenotype analysis performed on genomic alterations of integrative hiPSCs
(A) Pie charts of gene locus alterations observed by aCGH technology on genomic DNA of hiPSCs cells: the yellow part represents gene loci that are known as to be polymorphism CNV in Toronto database and the blue part represents gene loci which passed the polymorphism filtration. (B) variation type of CNV (gain/loss). (C) Histogram of loss and gain CNVs observed by different hiPSCs methods affecting gene locus present in PluriNet database. (D) Pluripotent stem-cell-specific protein-protein interaction network detected by PluriNet database in genomic aCGH alterations from integrative hiPSCs: Nucleus and cytosolic cellular compartments are separated on the network, gene locus alterations are represented by nodes and protein-protein interactions by links obtained with STRING10 application (blue link: protein interaction database source; pink link: experimental interaction, green link: neighborhood molecule), red nodes represent genes belonging to the most enriched biological process on gene ontology database: nitrogen compound metabolism process. (E) Analysis of PluriNet genomic aCGH alterations from integrative hiPSCs in the context of MGI-mouse phenotype which predict Mammalian phenotype (blue bars of the histogram represent enrichment negative base 10 logarithm of p-value with Benjamini, Hochberg correction for multi-testing, orange bars represent number of MGI mouse phenotype which matched with alterations).
Figure 2
Figure 2. PluriNet and Mammalian phenotype analysis performed on genomic alterations of non-integrative hiPSCs
(A) Pluripotent stem-cell-specific protein-protein interaction network detected by PluriNet database in genomic aCGH alterations from hiPSCs generated with Sendai viruses: Nucleus and cytosolic cellular compartments are separated on the network, gene locus alterations are represented by nodes and protein-protein interactions by links obtained with STRING10 application (blue link: protein interaction database source; pink link: experimental interaction, green link: neighborhood molecule), red nodes represent genes belonging to the most enriched biological process on gene ontology database: RNA processing. (B) Analysis of PluriNet genomic aCGH alterations from Sendai derived-hiPSCs in the context of MGI-mouse phenotype which predict Mammalian phenotype (blue bars of the histogram represent enrichment negative base 10 logarithm of p-value with Benjamini, Hochberg correction for multi-testing, orange bars represents number of MGI mouse phenotype which matched with alterations). (C) Pluripotent stem-cell-specific protein-protein interaction network detected by PluriNet database in genomic aCGH alterations from mRNA derived-hiPSCs: Nucleus and cytosolic cellular compartments are separated on the network, gene locus alterations are represented by nodes and protein-protein interactions by links obtained with STRING10 application (pink link: experimental interaction).
Figure 3
Figure 3. Cancer related gene locus found to be altered by aCGH in hiPSCs cells
(A) Circos plot of functional enrichment performed on gene ontology-biological process and Biomart-biomarkers databases with gene locus aCGH alterations obtained on hiPSCs cells with the 3 methods: lentivirus, Sendai virus and mRNA. (B) Venn diagram of cancer related genes found in COSMIC database with aCGH genomic alterations from hiPSCs cells performed with 3 different methods: lentivirus, Sendai virus and mRNA. (C) Karyotype ideogram of cancer related genes found in COSMIC database with aCGH genomic alterations from hiPSCs cells performed with 3 different methods: lentivirus (red), Sendai virus (blue) and mRNA (black). (D) Pie charts of oncogenic categories for aCGH genomic alterations from hiPSCs cells obtained by Lentivirus and Sendai virus methods.
Figure 4
Figure 4. Cancer related gene locus found to be altered by aCGH in teratomas
(A) Pie charts of gene locus alterations observed by aCGH technology on genomic DNA of teratoma: the orange part represents gene loci that are known as to be polymorphism CNV in Toronto database and the blue part represents gene loci which passed the polymorphism filtration. (B) Circos plot of functional enrichment performed on gene ontology-biological process database with gene locus aCGH alterations obtained on teratoma with the 3 methods: lentivirus, Sendai virus and mRNA. (C) Karyotype ideogram of cancer related genes found in COSMIC database with aCGH genomic alterations from teratoma performed with lentivirus (red), Sendai virus (blue) methods.
Figure 5
Figure 5. Histological analysis of teratomas by haematoxylin and eosin staining (HES)
(A) intestinal epitheliums. (B) cartilaginous areas. (C) muscle. (D) bone structures. (E) glial tissues and neural crest. (F) malpighian epitheliums. (G) plexus choroid. (H) peripheral nerves and fatty tissue. (I) bronchial glands. (J) urinary epithelium with a muscular wall. (K) neuroendocrine tissue. (L) glomerular like structure. (M) Teratoma histological analysis showing malignant tumor by haematoxylin and eosin staining (HES). (N) Immunohistochemistry for CD30. (O) Immunohistochemistry for PLAP. (P) Immunohistochemistry for c-kit.
Figure 6
Figure 6. Passage number rate integration analysis of cancer related gene locus found to be altered by aCGH in hiPSCs
(A) Pie charts of gene locus alterations observed by aCGH technology on genomic DNA of hiPSCs taking into account the number of passages (less or more than 20 passages: the orange part represents gene loci that are known as to be polymorphism CNV in Toronto database and the blue part represents gene loci which passed the polymorphism filtration. (B) Circos plot of functional enrichment performed on gene ontology-biological process, CTD-diseases and Biomart-biomarkers databases with gene locus aCGH alterations obtained on hiPSCs taking into account the number of passage (less or more than 20 passages). (C) Venn diagram of cancer related genes found in COSMIC database with aCGH genomic alterations from hiPSCs cells comparing low and high number of passages. (D) histogram of COSMIC events by chromosome in aCGH for hiPSCs cells (low and high number of passages), events are normalized by megabase on version HG19 of human genome.
Figure 7
Figure 7. Passage number integration analysis of cancer related gene loci found to be altered by aCGH in teratomas
(A) Pie charts of gene locus alterations observed by aCGH technology on genomic DNA of teratoma taking account of hiPSCs passage number (<20 or >20 passages): the orange part represents gene loci that are known as to be polymorphism CNV in Toronto database and the blue part represents gene loci which passed the polymorphism filtration. (B) Pie charts of gene locus alterations observed by aCGH technology on genomic DNA of teratoma taking account of teratoma malignancy status: the orange part represents gene loci that are known as to be polymorphism CNV in Toronto database and the blue part represents gene loci which passed the polymorphism filtration. (C) Circos plot of functional enrichment performed on gene ontology-biological process and Biomart-biomarkers databases with gene locus aCGH alterations obtained on teratoma taking account of malignancy status. (D) Venn diagram comparing cancer related gene locus aCGH altered in teratoma with low number of passages (<20) and in teratoma with malignancy. (E) Karyotype ideogram of cancer related genes found in COSMIC database with aCGH genomic alterations from teratoma taking into account the number of passages (blue: more than 20 passages, red: less than 20 passages). (F) Karyotype ideogram of cancer related genes found in COSMIC database with aCGH genomic alterations from teratoma taking into account the malignancy status of teratoma (blue: benign, red: malignant).

Similar articles

Cited by

References

    1. Hussein SM, Batada NN, Vuoristo S, Ching RW, Autio R, Närvä E, Ng S, Sourour M, Hämäläinen R, Olsson C, Lundin K, Mikkola M, Trokovic R, et al. Copy number variation and selection during reprogramming to pluripotency. Nature. 2011;471:58–62. - PubMed
    1. Schlaeger TM, Daheron L, Brickler TR, Entwisle S, Chan K, Cianci A, DeVine A, Ettenger A, Fitzgerald K, Godfrey M, Gupta D, McPherson J, Malwadkar P, et al. A comparison of non-integrating reprogramming methods. Nat Biotechnol. 2015;33:58–63. - PMC - PubMed
    1. Fusaki N, Ban H, Nishiyama A, Saeki K, Hasegawa M. Efficient induction of transgene-free human pluripotent stem cells using a vector based on Sendai virus, an RNA virus that does not integrate into the host genome. Proc Jpn Acad Ser B Phys Biol Sci. 2009;85:348–362. - PMC - PubMed
    1. Warren L, Manos PD, Ahfeldt T, Loh YH, Li H, Lau F, Ebina W, Mandal PK, Smith ZD, Meissner A, Daley GQ, Brack AS, Collins JJ, et al. Highly efficient reprogramming to pluripotency and directed differentiation of human cells with synthetic modified mRNA. Cell Stem Cell. 2010;7:618–30. - PMC - PubMed
    1. Müller FJ, Laurent LC, Kostka D, Ulitsky I, Williams R, Lu C, Park IH, Rao MS, Shamir R, Schwartz PH, Schmidt NO, Loring JF. Regulatory networks define phenotypic classes of human stem cell lines. Nature. 2008;455:401–405. - PMC - PubMed

LinkOut - more resources