. 2019 Apr 1;9(4):730-739.
eCollection 2019.

HMGB1 regulates erastin-induced ferroptosis via RAS-JNK/p38 signaling in HL-60/NRASQ61L cells

Affiliations

HMGB1 regulates erastin-induced ferroptosis via RAS-JNK/p38 signaling in HL-60/NRASQ61L cells

Fanghua Ye et al. Am J Cancer Res. .

Abstract

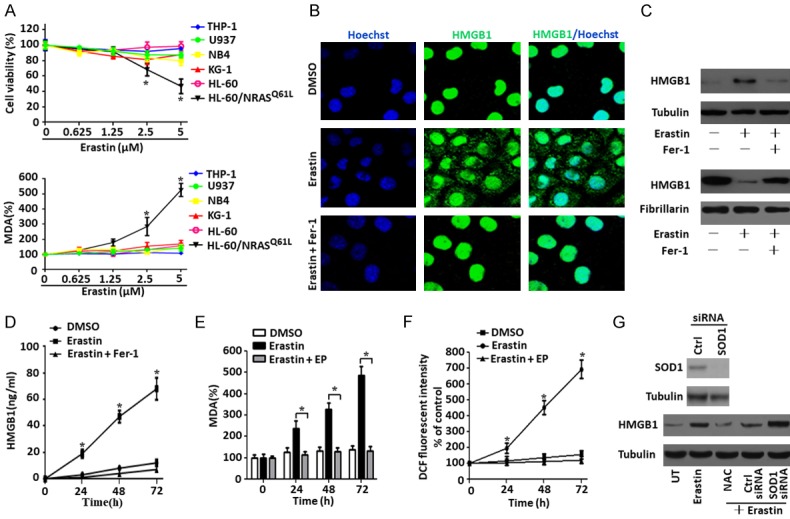
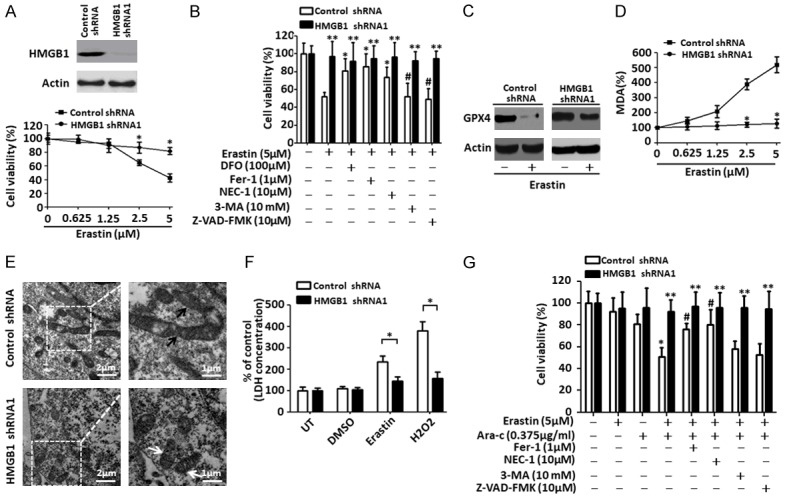
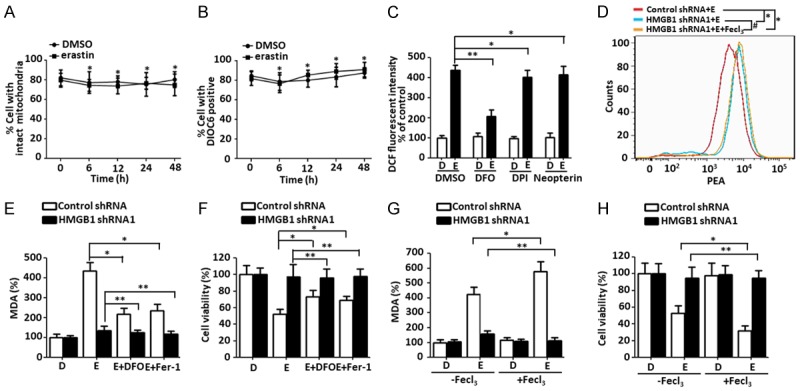
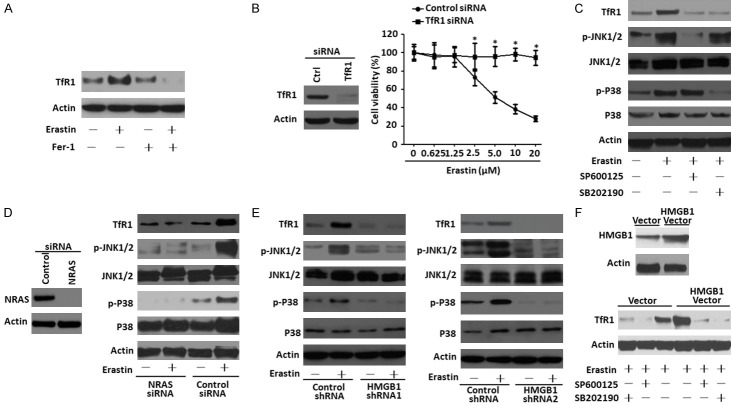
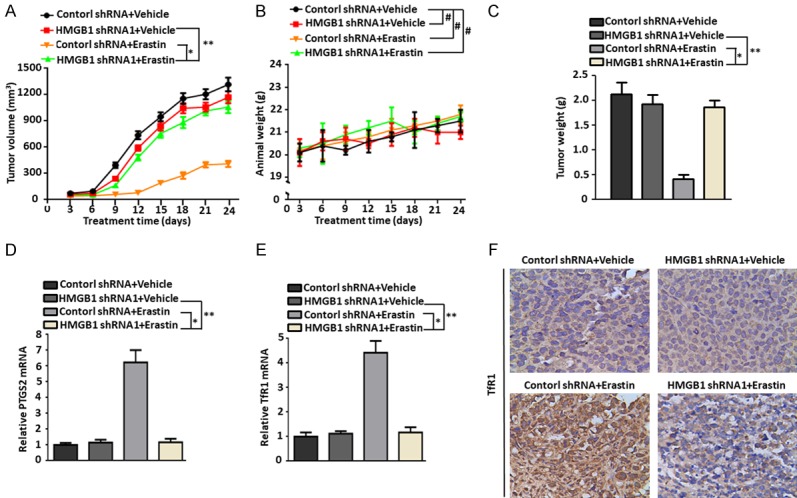
Ferroptosis is emerging as a new form of regulated cell death driven by oxidative injury promoting lipid peroxidation in an iron-dependent manner. High mobility group box 1 (HMGB1) plays an important role in leukemia pathogenesis and chemotherapy resistance. The mechanisms of ferroptosis in tumor pathogenesis and treatment have been a recent research focus but the role of HMGB1 in regulating ferroptosis especially in leukemia still remains largely unknown. Here, we shown that HMGB1 is a critical regulator of eratin-induced ferroptosis in HL-60 cell line expressing NRASQ61L (HL-60/NRASQ61L). Erastin enhanced ROS levels, thereby promoting cytosolic translocation of HMGB1 and enhancing cell death. Knockdown of HMGB1 decreased erastin-induced ROS generation and cell death in an iron-mediated lysosomal pathway in HL-60/NRASQ61L cells. Knockdown of HMGB1 or rat sarcoma (RAS), or pharmacological inhibition of JNK and p38 decreased TfR1 levels in HL-60/NRASQ61L cells. Importantly, these data were further supported by our in vivo experiment, in which xenografts formed by HMGB1 knockdown HL-60/NRASQ61L cells had lower PTGS2 and TfR1 expression than that in control mice. Taken together, these results suggest that HMGB1 is a novel regulator of ferroptosis via the RAS-JNK/p38 pathway and a potential drug target for therapeutic interventions in leukemia.

Keywords: HMGB1; MAPK; acute myeloid leukemia; ferroptosis; transferrin receptor 1.


Conflict of interest statement

None.

Figures

Figure 1
Figure 1
Erastin promotes ROS-dependent extranuclear HMGB1 translocation. A. Different types of leukemia cells were treated with erastin at the indicated doses for 48 h, intracellular MDA levels and cell viability were assayed (n = 3, *P < 0.05 versus untreated group or other cell lines). B and C. HL-60/NRASQ61L cells were treated with erastin (5 μM) with or without Fer-1 (1 μM) pretreatment for 48 h, and then the nuclear/cytosolic HMGB1 expression was assayed by immunofluorescence and western blot (Green, HMGB1; blue, nucleus). D. HL-60/NRASQ61L cells were treated with erastin (5 μM) for 24-72 h with or without Fer-1 (1 μM) pretreatment. The release of HMGB1 was analyzed by ELISA (n = 3, *P < 0.05 versus the erastin plus Fer-1 treatment group). E. Intracellular MDA levels were assayed in HL-60/NRASQ61L cells after treatment with erastin in the absence or presence of EP (5 mM) pretreatment for 24-72 h (n = 3, *P < 0.05). F. HL-60/NRASQ61L cells were treated with erastin (5 μM) for 24-72 h with or without (EP, 5 mM) pretreatment. ROS production was assessed by measuring the fluorescent intensity of DCF on a fluorescence plate reader. The incremental production of ROS was expressed as a percentage of the control (n = 3, *P < 0.05 versus the erastin plus EP treatment group). G. HL-60/NRASQ61L cells were transfected with control siRNA vector and SOD1 siRNA, the SOD1 expression was verified by western blot. HL-60/NRASQ61L cells were treated with erastin (5 μM) for 48 h with or without NAC (25 mM) or SOD1 RNAi or control RNAi pretreatment. Cytosolic HMGB1 expression was assayed by western blot. All experiments were conducted in triplicate, and the data are presented as the mean ± SD. Ctrl, control; UT, untreated; Fer-1, ferrostatin-1; EP, ethyl pyruvate; NAC, N-acetylcysteine.
Figure 2
Figure 2
Depletion of HMGB1 inhibits erastin-induced cell death and anticancer activity. A. HL-60/NRASQ61L cells were transfected with HMGB1 shRNA1 or control shRNA vector, HMGB1 expression was verified by western blot. Then, two groups of cells were stimulated with erastin at the indicated doses for 48 h. Cell viability was assayed. (n = 3, *P < 0.05 versus the control group). B. HL-60/NRASQ61L cells were transfected with HMGB1 shRNA1 or control shRNA vector and then stimulated with erastin (5 μM) with or without the indicated inhibitors for 48 h. Cell viability was assayed. (n = 3, *P < 0.05 versus the erastin treatment only control shRNA group; #P > 0.05 versus the erastin treatment only control shRNA group; **P > 0.05 versus the untreated HMGB1 shRNA group). C and D. HL-60/NRASQ61L cells were transfected with HMGB1 shRNA1 and control shRNA vector and then stimulated with erastin (5 μM) for 48 h. GPX4 and intracellular MDA levels were assayed (n = 3, *P < 0.05 versus the control group). E. Ultrastructural features of HL-60/NRASQ61L cells with HMGB1 shRNA1 and control shRNA vector transfection plus erastin (5 μM) treatment (white arrow, normal mitochondria; black arrow, shrunken mitochondria). F. HL-60/NRASQ61L cells were transfected with HMGB1 shRNA1 and control shRNA vector and then stimulated with DMSO, erastin (5 μM), and H2O2 (50 mM) for 48 h. The LDH level in the culture medium was assayed. H2O2 was used as a positive control. UT, untreated. (n = 3, *P < 0.05). G. HL-60/NRASQ61L cells were transfected with HMGB1 shRNA1 and control shRNA vector and then stimulated with erastin (1.25 μm) combined with cytarabine (Ara-C, 0.375 μg/mL) in the absence or presence of the indicated inhibitors for 48 h. Cell viability was assayed. (n = 3, *P < 0.05 versus the erastin treatment only control shRNA group; #P < 0.05 versus the erastin plus cytarabine treatment control shRNA group; **P > 0.05 versus the untreated HMGB1 shRNA1 group). All experiments were conducted in triplicate, and the data are presented as the mean ± SD. DFO, deferoxamine; Fer-1, ferrostatin-1; NEC-1, necrostatin-1; 3-MA, 3-methyladenine; Ara-C, cytarabine.
Figure 3
Figure 3
Lack of HMGB1 limits iron-mediated ROS generation and cell death. A and B. HL-60/NRASQ61L cells were treated with DMSO or erastin (5 μM) for 0-48 h, respectively. Intact mitochondria and mitochondrial membrane potential were quantified by flow cytometry with MitoTracker Red (50 nM) and DIOC6 (1 μM) as described in the Materials and Methods section, respectively (n = 3, *P > 0.05). C. HL-60/NRASQ61L cells were treated with erastin (5 μM) combined with DFO (0.1 mM), DPI (5 μM), and neopterin (50 nM) for 48 h. ROS production was assessed by measuring the fluorescent intensity of DCF on a fluorescence plate reader. The incremental production of ROS was expressed as a percentage of the control. D, DMSO; E, erastin. (n = 3, *P > 0.05, **P < 0.05). D. HL-60/NRASQ61L cells were transfected with HMGB1 shRNA1 and control shRNA vector and then stimulated with erastin (5 μM) with or without FeCl3 (30 μM, pretreated for 3 h) for 48 h. Then, cells were stained with PGSK, and the fluorescence profile of the stained cells was analyzed by flow cytometry. E, erastin. E and F. HL-60/NRASQ61L cells were transfected with HMGB1 shRNA1 and control shRNA vector and then stimulated with erastin (5 μM) combined with DFO (0.1 mM) and Fer-1 (1 μM) for 48 h. Intracellular MDA levels and cell viability were assayed. D, DMSO; E, erastin. (n = 3, *P < 0.05, **P > 0.05). G and H. HL-60/NRASQ61L cells were transfected with HMGB1 shRNA1 and control shRNA vector, and then stimulated with erastin (5 μM) with or without FeCl3 (30 μM, pretreated for 3 hours) for 48 h. Intracellular MDA levels and cell viability were then assayed. (n = 3, *P < 0.05, **P > 0.05). Necrostatin-1 pretreatment was used in all experiments. All experiments were conducted in triplicate, and the data are presented as the mean ± SD. D, DMSO; E, erastin; DFO, deferoxamine; DPI, diphenyleneiodonium chloride.
Figure 4
Figure 4
HMGB1 regulates TfR1 expression in the RAS-JNK/p38-dependent pathway. A. HL-60/NRASQ61L cells were lysed after treatment with erastin (5 μM) and/or Fer-1 (1 μM), then TfR1 expression was verified by western blot. B. HL-60/NRASQ61L cells were transfected with TfR1 siRNA and control siRNA, and TfR1 expression was verified by western blot. Then the two groups of cells were stimulated with erastin at the indicated doses for 48 h. Cell viability was assayed. Ctrl, control. (n = 3, *P < 0.05 versus the control group). C. HL-60/NRASQ61L cells were treated with erastin (5 μM) combined with SP600125 (10 μM) and SB202190 (10 μM) for 48 h. TfR1 expression and the phosphorylation of p38 (p-P38) and JNK1/2 (p-JNK1/2) were assayed by western blot. D. HL-60/NRASQ61L cells were transfected with NRAS siRNA and control siRNA vector, and NRAS expression was verified by western blot. Then two groups of cells were stimulated with erastin (5 μM) for 48 h. TfR1, p-P38 and p-JNK1/2 were assayed by Western blot. Ctrl, control. E. HL-60/NRASQ61L cells were transfected with HMGB1 shRNA (HMGB1 shRNA1 and HMGB1 shRNA2) and control shRNA vector and then stimulated with erastin (5 μM) for 48 h. TfR1, p-P38 and p-JNK1/2 expression levels were assayed by western blot. F. HL-60/NRASQ61L cells were transfected with HMGB1 plasmid and empty vector, and HMGB1 expression was verified by western blot. Then, two groups of cells were stimulated with erastin (5 μM) combined with SP600125 (10 μM) and SB202190 (10 μM) for 48 h. TfR1 expression was assayed by western blot. Necrostatin-1 pretreatment was used in all experiments. All experiments were conducted in triplicate, and the data are presented as the mean ± SD. Fer-1, ferrostatin-1.
Figure 5
Figure 5
Knockdown of HMGB1 expression inhibited anticancer activity of erastin in vivo. A-C. NOD/SCID mice were injected subcutaneously with HMGB1 shRNA1 HL-60/NRASQ61L cells (1 × 10⁶ cells/mouse) and treated with erastin (20 mg/kg i.v., twice every other day) starting at day seven for two weeks. Tumor volumes and animal weight were measured twice a week. At the termination of the experiments, all xenografts were removed and weighted (n = 4 mice/group, *P < 0.05, **P > 0.05, #P > 0.05). D and E. qPCR analysis of PTGS2 and TfR1 gene expressions in isolated tumors at the termination of experiments (*P < 0.05, **P > 0.05). F. Immunohistochemical staining of TfR1 was performed with an isolated tumor at the termination of the experiments. All experiments were conducted in triplicate, and the data are presented as the mean ± SD.

Similar articles

Cited by

References

    1. Ross DD. Novel mechanisms of drug resistance in leukemia. Leukemia. 2000;14:467–473. - PubMed
    1. Metzig M, Gdynia G, Roth W. Mechanisms of cell death. Novel insights and implications for tumor pathology. Pathologe. 2012;33(Suppl 2):241–245. - PubMed
    1. Dixon SJ, Lemberg KM, Lamprecht MR, Skouta R, Zaitsev EM, Gleason CE, Patel DN, Bauer AJ, Cantley AM, Yang WS, Morrison B 3rd, Stockwell BR. Ferroptosis: an iron-dependent form of nonapoptotic cell death. Cell. 2012;149:1060–1072. - PMC - PubMed
    1. Fatokun AA, Dawson VL, Dawson TM. Parthanatos: mitochondrial-linked mechanisms and therapeutic opportunities. Br J Pharmacol. 2014;171:2000–2016. - PMC - PubMed
    1. Yu Y, Xie Y, Cao L, Yang L, Yang M, Lotze MT, Zeh HJ, Kang R, Tang D. The ferroptosis inducer erastin enhances sensitivity of acute myeloid leukemia cells to chemotherapeutic agents. Mol Cell Oncol. 2015;2:e1054549. - PMC - PubMed

LinkOut - more resources