. 2019 Apr 1;9(4):765-778.
eCollection 2019.

MiR-374b re-sensitizes hepatocellular carcinoma cells to sorafenib therapy by antagonizing PKM2-mediated glycolysis pathway

Affiliations

MiR-374b re-sensitizes hepatocellular carcinoma cells to sorafenib therapy by antagonizing PKM2-mediated glycolysis pathway

Mukun Zhang et al. Am J Cancer Res. .

Abstract

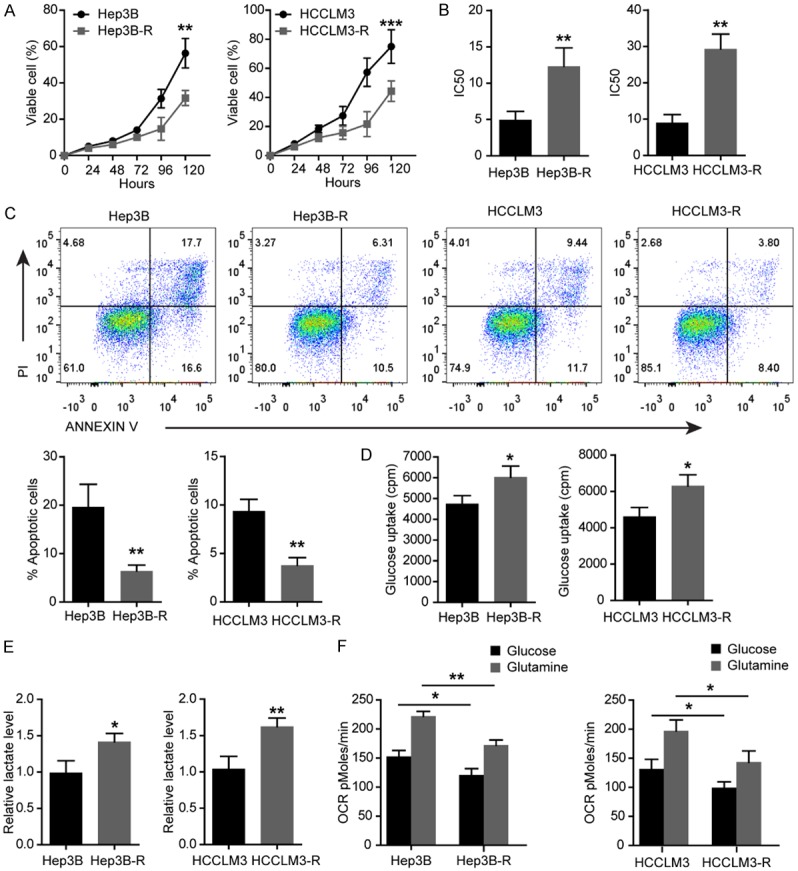
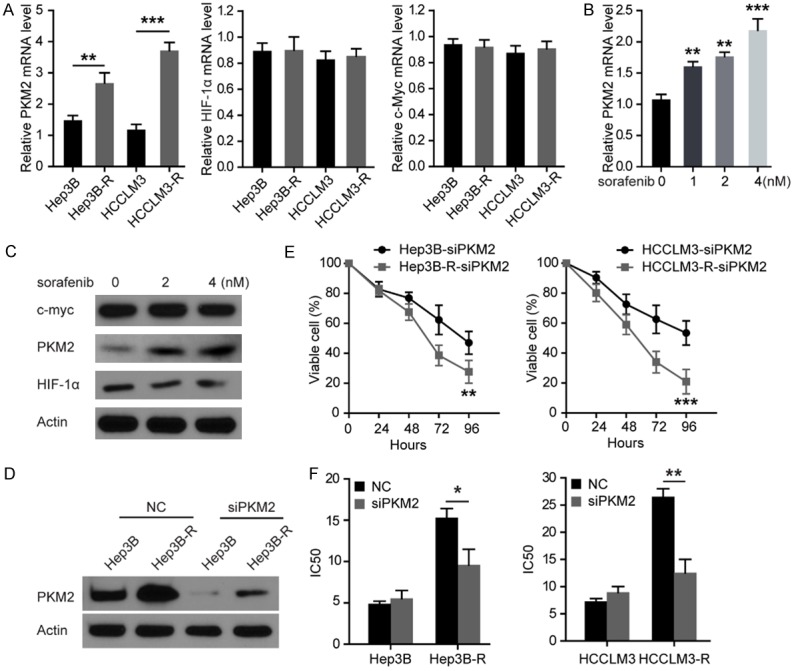
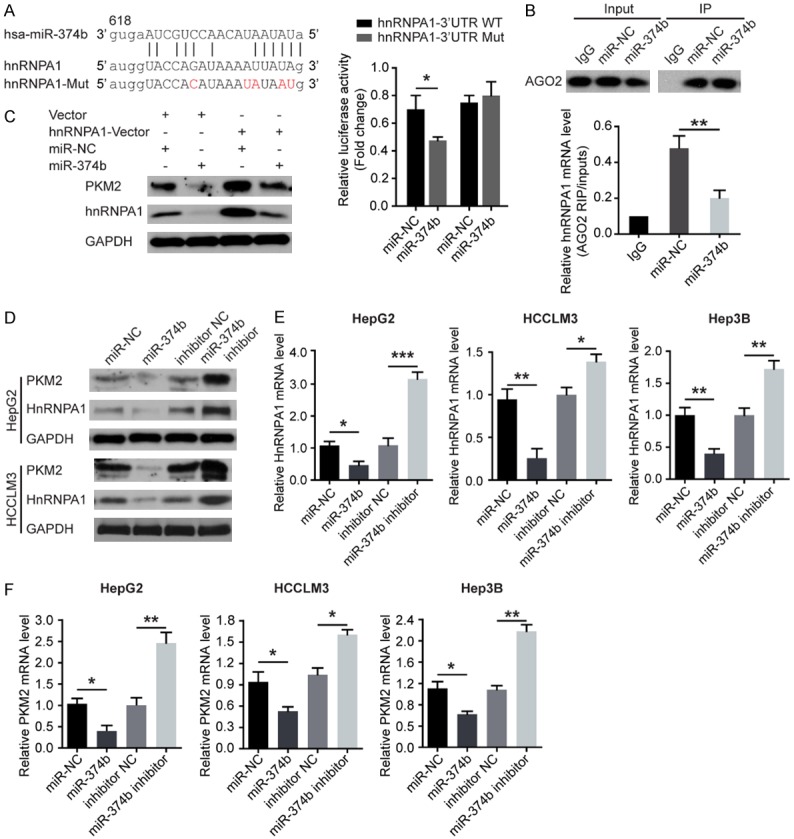
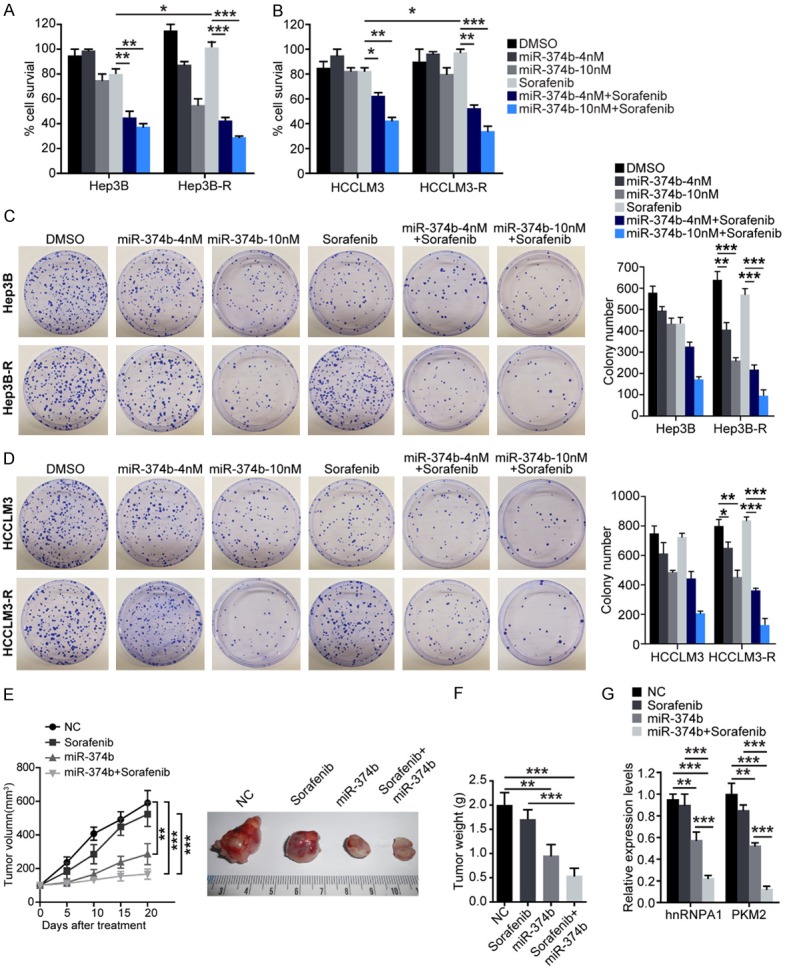
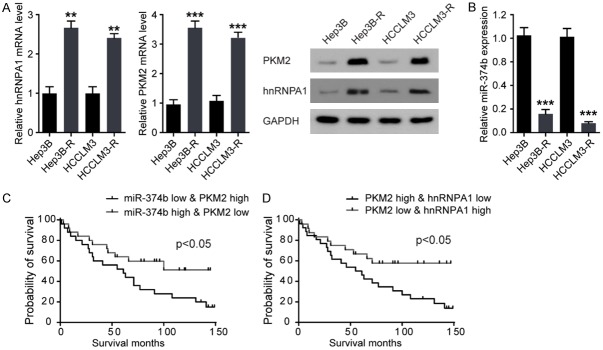
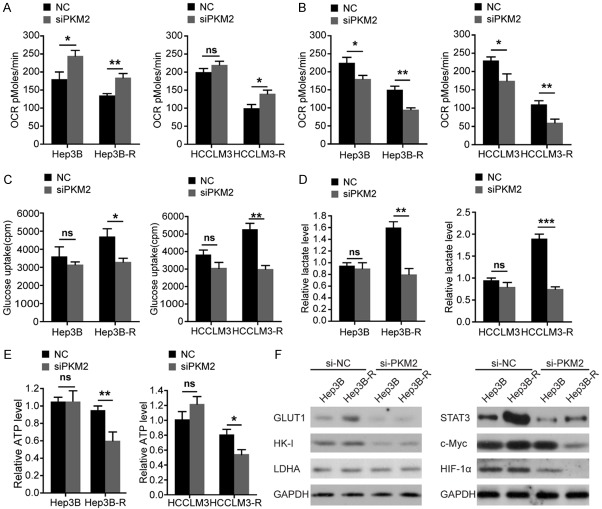
Despite impressively initial clinical responses, the majority of hepatocellular carcinoma (HCC) patients treated with sorafenib eventually develop resistance to this drug. It is well-known that microRNA (miRNA) plays a critical role in HCC progression and sorafenib resistance. However, the potential mechanism by which miRNA contributes to the human HCC cells to sorafenib resistance is still unknown. Herein, we identify miR-374b/hnRNPA1/PKM2 axis serving as an important mechanism for acquired sorafenib resistance of HCC cells. By establishing a sorafenib-resistant HCC model, we demonstrated that miR-374b reduces the expression of hnRNPA1 by binding to its 3' untranslated region, which subsequently decreases levels of PKM2. The suppression of PKM2 by miR-374b re-sensitizes sorafenib-resistant HCC cells and mouse xenografts to sorafenib treatment by antagonizing glycolysis pathway. Clinically, hnRNPA1 and PKM2 expression are upregulated and inversely associated with miR-374b expression level in sorafenib-resistant HCC patients. Moreover, sorafenib significantly induces the expression of hnRNPA1, which serves as an important mechanism for the acquired sorafenib resistance in HCCs. Thus, our data suggest that targeting the alternative splicing of the PKM by miR-374b overexpression may have significant implications in overcoming the resistance to sorafenib therapy.

Keywords: MiR-374b; PKM2; hepatocellular carcinoma; hnRNPA1; sorafenib.


Conflict of interest statement

None.

Figures

Figure 1
Figure 1
Elevated glycolysis and decreased apoptosis in sorafenib-resistant Hep3B-R and HCCLM3-R cells. A. The viability of Hep3B-R and HCCLM3-R cells determined by CCK8 assays compared with their parental cell lines. B. Comparing IC50 for sorafenib in indicated HCC cells after sorafenib treatment for 48 h. C. Comparing apoptosis in indicated HCC cells treated with 10 nM sorafenib for 48 h and its representation in bar format. D. Analysis of glucose uptake in Hep3B and Hep3B-R cells. E. Lactate production rate detected in indicated HCC cells. F. OCR in indicated HCC cells using glucose or glutamine as the carbon source. n = 3; *P < 0.05, **P < 0.01, ***P < 0.001. P values were calculated with student’s t-test.
Figure 2
Figure 2
Silencing PKM2 restores Hep3B-R and HCCLM3-R cells’ sensitivity to sorafenib. A. Comparative analysis of mRNA levels of HIF-1α, myc and PKM2 in indicated HCC cells. B. The mRNA levels of PKM2 were detected by qRT-PCR under increasing concentrations of sorafenib in indicated HCC cells. C. Western blot performed with antibodies against HIF1a, myc, PKM2 and GAPDH on cell lysates from Hep3B cells treated with increasing concentrations of sorafenib for 48 h. D. Western blot performed with antibodies against PKM2 on cell lysates from indicated HCC cells transfected with scrambled siRNA (NC) or PKM2 siRNA. E. Cell survival rate determined by CCK8 assay after treatment of indicated HCC cells with PKM2 siRNA. F. IC50 for sorafenib in indicated HCC cells after treatment for 48 h with sorafenib. Inhibition of PKM2 restored Hep3B-R and HCCLM3-R cell sensitivity to sorafenib. n = 3; *P < 0.05, **P < 0.01, ***P < 0.001. P values were calculated with student’s t-test.
Figure 3
Figure 3
MiR-374b inhibits PKM2 expression by directly binding to hnRNPA1 in HCC cells. A. Graphic of the seed sequence of miR-374b matched with the 3’-UTR of the hnRNPA1 gene, and the design of wild-type or mutant hnRNPA1 3’-UTRs containing reporter constructs. Luciferase reporter assays in HCC cells after co-transfection of cells with wild-type or mutant hnRNPA1 3’-UTR and miR-374b. B. AGO2 protein was immunoprecipitated from cell extracts with an AGO2 antibody, or IgG. And the amount of hnRNPA1 mRNA bound to AGO2 or IgG was assayed using qRT-PCR in the presence of miR-374b mimics or control. C. The effect of miR-374b overexpression on hnRNPA1 and PKM2 protein expression after cells were transfected with the hnRNPA1 plasmid or empty vector. D. Western blot of hnRNPA1 and PKM2 expression 48 hours after cells were transfected with miR-374b or with anti-miR-374b. E. qRT-PCR of hnRNPA1 mRNA expression 48 hours after transfection. F. qRT-PCR of PKM2 mRNA expression 48 hours after transfection. n = 3; *P < 0.05, **P < 0.01, ***P < 0.001. P values were calculated with student’s t-test.
Figure 4
Figure 4
Combination treatment with miR-374b and sorafenib re-sensitizes resistant HCC cells to sorafenib treatment in vitro and in vivo. Hep3B and Hep3B-R (A) and HCCLM3 and HCCLM3-R (B) cells were treated with 4 or 10 nM miR-374b and 20 nM sorafenib either singly or in combination and cell survival was analyzed. Hep3B and Hep3B-R (C) and HCCLM3 and HCCLM3-R (D) cells were treated with 4 or 10 nM miR-374b and 20 nM sorafenib either singly or in combination for 24 h and the clonogenic ability of the surviving cells was analyzed. Right panels show quantification of the numbers of colonies formed by cells in the respective treatment groups. (E) 2×10⁶ Hep3B-R were injected sub-cutaneously into both flanks of SCID mice, and tumor growth was monitored. And the mice were randomly divided into 4 groups (n = 6/group) and treated with: 1) vehicle, 2) 25 mg/kg sorafenib via oral gavage daily for 5 days/week, 3) miR-374b transfection, and 4) a combination of miR-374b and sorafenib daily for 5 days/week. Tumors (n = 6/group) were monitored twice a week and were harvested and weighed at the end of 3 weeks. Tumor volumes (E) and weights (F) of tumors treated with the combination of miR-374b and sorafenib were significantly decreased. (G) Total RNAs from the tissues were measured by qRT-PCR for the expression levels of hnRNPA1 and PKM2. n = 3 (except E); *P < 0.05, **P < 0.01, ***P < 0.001. P values were calculated with student’s t-test.
Figure 5
Figure 5
HnRNPA1 and PKM2 expression are upregulated and inversely associated with miR-374b expression level in in sorafenib-resistant HCC cells and patients. A. HnRNPA1 and PKM2 mRNA expression were lower in sorafenib-sensitive parental HCC cell lines, compared with its resistant derivatives (left-panel). (Right-panel) HnRNPA1 and PKM2 protein levels were increased in sorafenib-resistant HCC cell lines. B. miR-374b expression levels were lower in sorafenib-resistant HCC cell lines than in sensitive cell lines. n = 3; **P < 0.01, ***P < 0.001 vs their parental cell lines respectively. P values were calculated with student’s t-test. C and D. Kaplan-Meier survival curves for patients from the patients with HCC. OS (defined as the interval in months from the date of initial surgical resection to the date of death or last follow-up) for patients (Training and Validation sets) with high-grade serious HCC classified according to the expression of PKM2, miR-374b, and hnRNPA1. P values were calculated with Log-rank (Mantel-cox) test.
Figure 6
Figure 6
Overcoming the sorafenib resistance of Hep3B-R and HCCLM3-R cells by PKM2 knockdown is attributed to glycolysis inhibition. A. OCR in indicated HCC cells treated by siPKM2 for 48 h using glucose as the carbon source. B. OCR in indicated HCC cells treated by siPKM2 for 48 h using glutamine as the carbon source. C. Glucose uptake in indicated HCC cells transfected with si-PKM2. The indicated cells were cultured in DMEM with 18F-FDG for 1 hour, and the radioactivity was examined by the well γ-counter. D. Lactate production rate determined in indicated HCC cells 48 h post-transfection with si-PKM2. E. Measurement of ATP levels in cells 48 h post-transfection with si-PKM2. F. Effects of si-PKM2 on the expression of GLUT1, HK-I, and LDHA 48 h post-transfection (left-panel). (Right-panel) Effects of si-PKM2 on the expression of c-Myc, STAT3, and HIF-1α 48 h post-transfection. n = 3; *P < 0.05, **P < 0.01, ***P < 0.001 and ns: no significant difference. P values were calculated with student’s t-test.

Similar articles

Cited by

References

    1. Lee J, Lee JH, Yoon H, Lee HJ, Jeon H, Nam J. Extraordinary radiation super-sensitivity accompanying with sorafenib combination therapy: what lies beneath? Radiat Oncol J. 2017;35:185–188. - PMC - PubMed
    1. Kowolik CM, Lin M, Xie J, Overman LE, Horne DA. NT1721, a novel epidithiodiketopiperazine, exhibits potent in vitro and in vivo efficacy against acute myeloid leukemia. Oncotarget. 2016;7:86186. - PMC - PubMed
    1. Rimassa L, Abbadessa G, Personeni N, Porta C, Borbath I, Daniele B, Salvagni S, Van Laethem JL, Van Vlierberghe H, Trojan J. Tumor and circulating biomarkers in patients with second-line hepatocellular carcinoma from the randomized phase II study with tivantinib. Oncotarget. 2016;7:72622. - PMC - PubMed
    1. Riedel M, Struve N, Müller-Goebel J, Köcher S, Petersen C, Dikomey E, Rothkamm K, Kriegs M. Sorafenib inhibits cell growth but fails to enhance radio-and chemosensitivity of glioblastoma cell lines. Oncotarget. 2016;7:61988. - PMC - PubMed
    1. Gardini AC, Santini D, Aprile G, Silvestris N, Felli E, Foschi FG, Ercolani G, Marisi G, Valgiusti M, Passardi A. Antiangiogenic agents after first line and sorafenib plus chemoembolization: a systematic review. Oncotarget. 2017;8:66699. - PMC - PubMed

LinkOut - more resources