

Metformin reverses PARP inhibitors-induced epithelial-mesenchymal transition and PD-L1 upregulation in triple-negative breast cancer
- PMID: 31106005
- PMCID: PMC6511636
Metformin reverses PARP inhibitors-induced epithelial-mesenchymal transition and PD-L1 upregulation in triple-negative breast cancer
Abstract
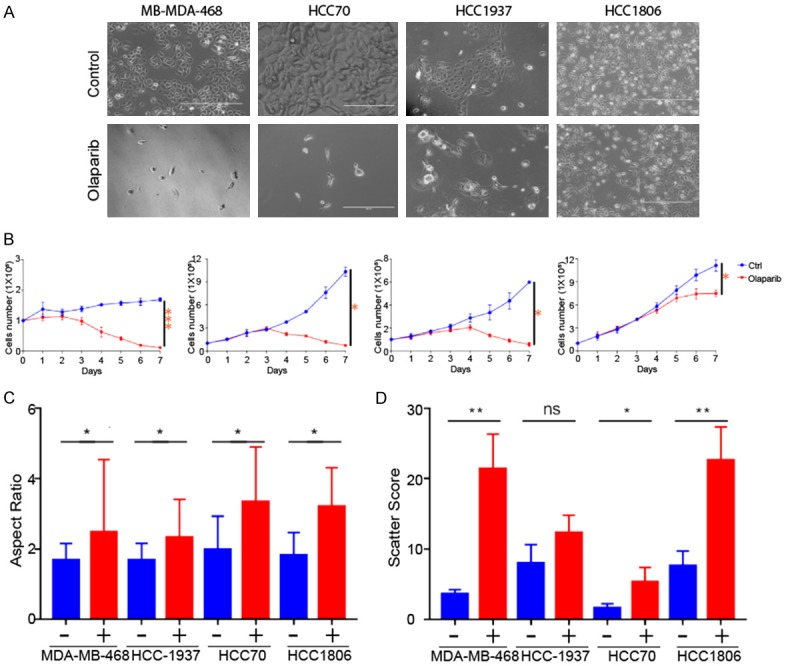
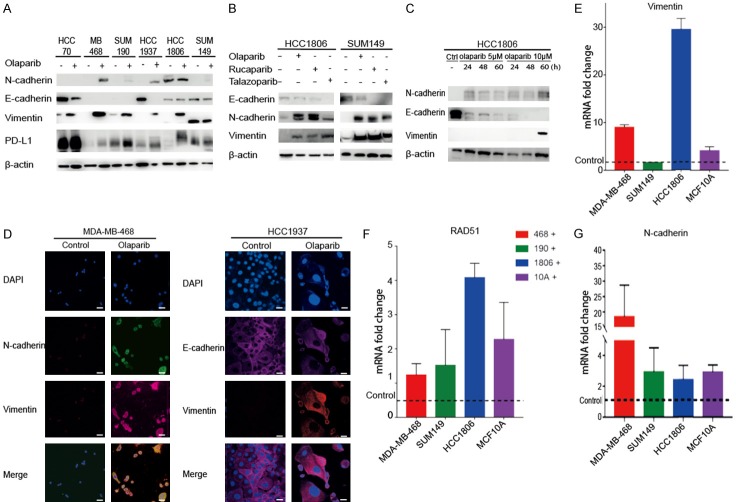
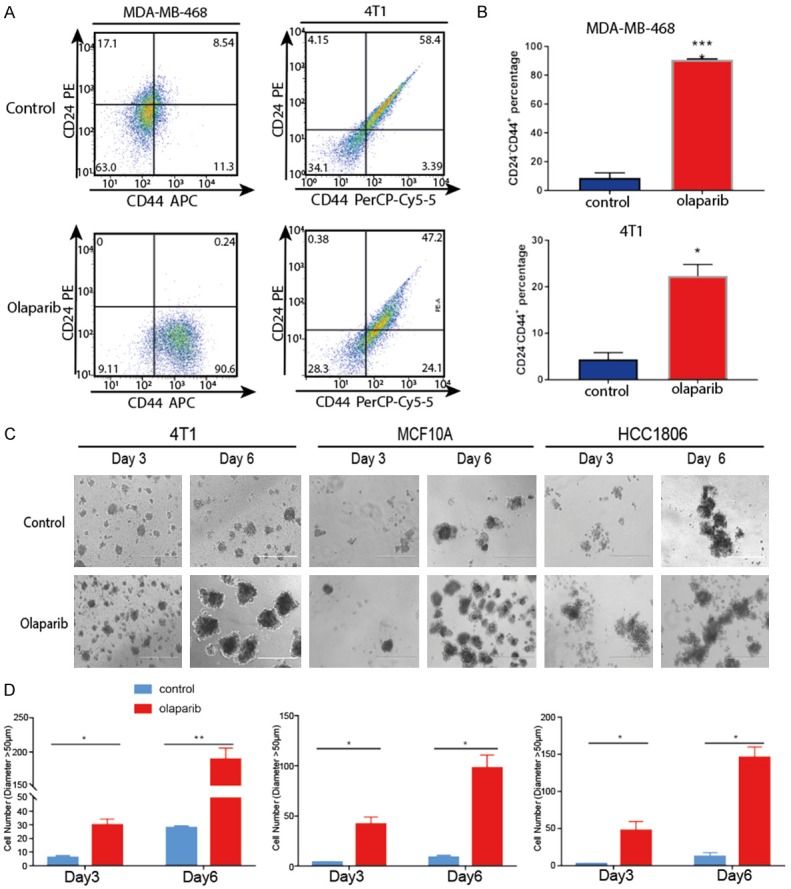
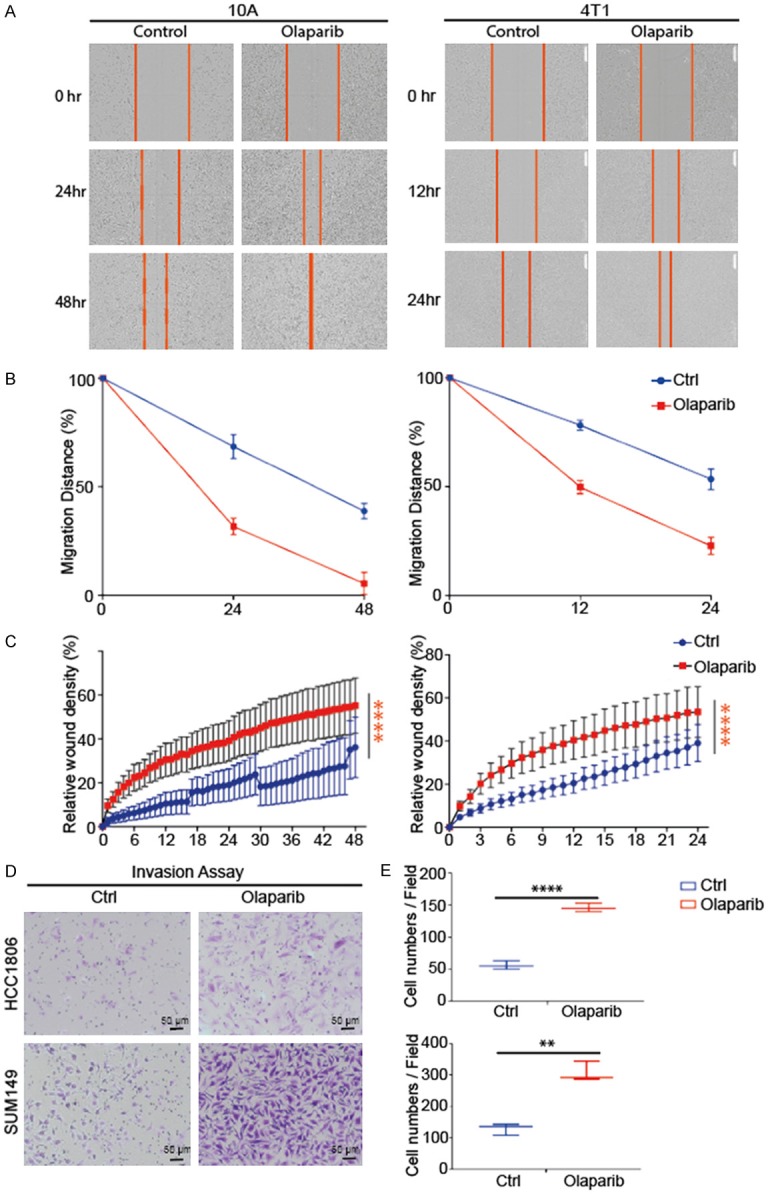
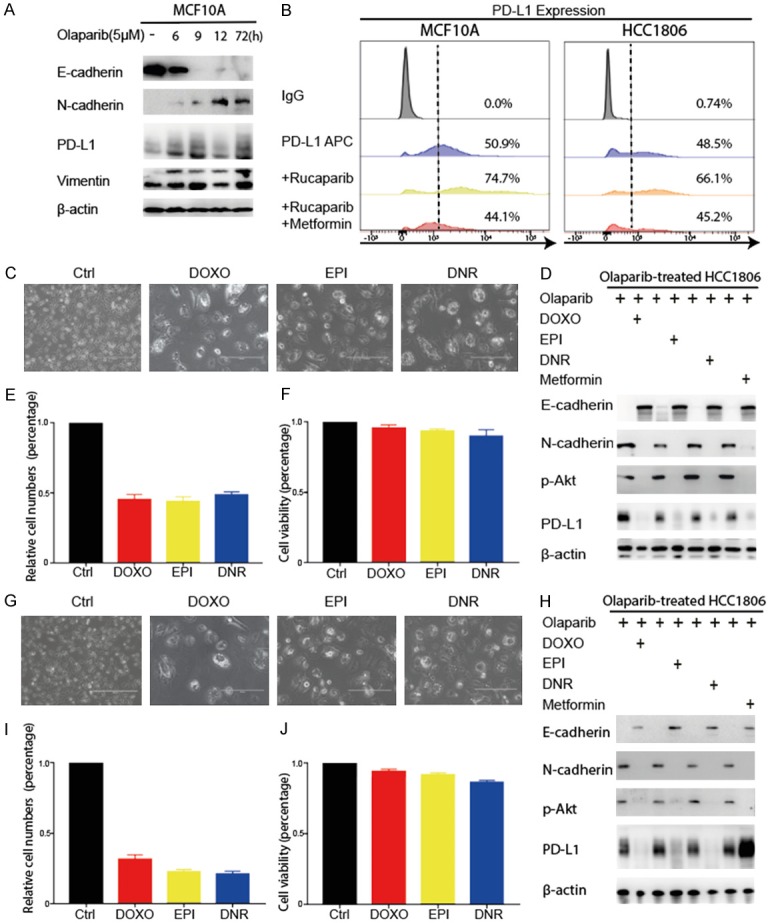
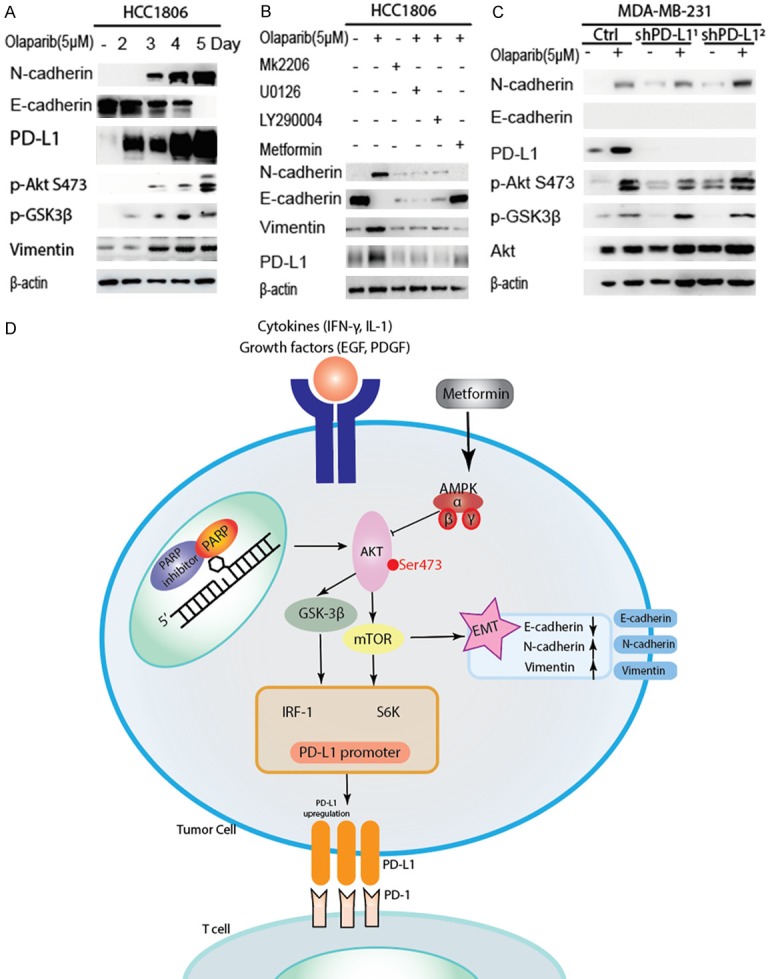
Poly (ADP-ribose) polymerase (PARP) inhibitors have emerged as promising targeted therapies for BRCA-mutated cancers by blocking repair of DNA double-strand breaks. However, resistance to PARP inhibitors (PARPi) has been described in some patients lowering the overall response rates. To investigate the underlying mechanisms of PARPi resistance, we developed the adaptive resistant clones in triple-negative breast cancer cell lines. We identified epithelial-mesenchymal transition (EMT) and upregulation of programmed death-ligand 1 (PD-L1) in resistant cells and further demonstrated the important role of Akt S473 phosphorylation in PARPi resistance. In addition, PARPi mediated EMT is independent of PD-L1 upregulation. Blocking the p-Akt S473 axis by metformin reversed EMT and PD-L1 expression which sensitized PARPi-resistant cells to cytotoxic T cells. Thus, a combination of metformin and PARP inhibitors may be a promising therapeutic strategy to increase the efficacy of PARP inhibitors and tumor sensitivity to immunotherapy.
Keywords: PARP; PD-L1; epithelial-mesenchymal transition; metformin; triple-negative breast cancer.
Conflict of interest statement
None.
Figures
Similar articles
-
PARP Inhibitor Upregulates PD-L1 Expression and Enhances Cancer-Associated Immunosuppression.Clin Cancer Res. 2017 Jul 15;23(14):3711-3720. doi: 10.1158/1078-0432.CCR-16-3215. Epub 2017 Feb 6. Clin Cancer Res. 2017. PMID: 28167507 Free PMC article.
-
PARP inhibitors in head and neck cancer: Molecular mechanisms, preclinical and clinical data.Oral Oncol. 2021 Jun;117:105292. doi: 10.1016/j.oraloncology.2021.105292. Epub 2021 Apr 14. Oral Oncol. 2021. PMID: 33862558 Review.
-
Synergism of PARP inhibitor fluzoparib (HS10160) and MET inhibitor HS10241 in breast and ovarian cancer cells.Am J Cancer Res. 2019 Mar 1;9(3):608-618. eCollection 2019. Am J Cancer Res. 2019. PMID: 30949414 Free PMC article.
-
An Effective Epigenetic-PARP Inhibitor Combination Therapy for Breast and Ovarian Cancers Independent of BRCA Mutations.Clin Cancer Res. 2018 Jul 1;24(13):3163-3175. doi: 10.1158/1078-0432.CCR-18-0204. Epub 2018 Apr 3. Clin Cancer Res. 2018. PMID: 29615458 Free PMC article.
-
Optimizing poly (ADP-ribose) polymerase inhibition through combined epigenetic and immunotherapy.Cancer Sci. 2018 Nov;109(11):3383-3392. doi: 10.1111/cas.13799. Epub 2018 Oct 20. Cancer Sci. 2018. PMID: 30230653 Free PMC article. Review.
Cited by
-
A new aspect of an old friend: the beneficial effect of metformin on anti-tumor immunity.BMB Rep. 2020 Nov;53(10):512-520. doi: 10.5483/BMBRep.2020.53.10.149. BMB Rep. 2020. PMID: 32731915 Free PMC article. Review.
-
Exploiting induced vulnerability to overcome PARPi resistance and clonal heterogeneity in BRCA mutant triple-negative inflammatory breast cancer.Am J Cancer Res. 2022 Jan 15;12(1):337-354. eCollection 2022. Am J Cancer Res. 2022. PMID: 35141022 Free PMC article.
-
Metformin Affects Olaparib Sensitivity through Induction of Apoptosis in Epithelial Ovarian Cancer Cell Lines.Int J Mol Sci. 2021 Sep 29;22(19):10557. doi: 10.3390/ijms221910557. Int J Mol Sci. 2021. PMID: 34638899 Free PMC article.
-
The Metformin Immunoregulatory Actions in Tumor Suppression and Normal Tissues Protection.Curr Med Chem. 2024;31(33):5370-5396. doi: 10.2174/0929867331666230703143907. Curr Med Chem. 2024. PMID: 37403391 Review.
-
Targeting of the tumor immune microenvironment by metformin.J Cell Commun Signal. 2022 Sep;16(3):333-348. doi: 10.1007/s12079-021-00648-w. Epub 2021 Oct 5. J Cell Commun Signal. 2022. PMID: 34611852 Free PMC article. Review.
References
-
- Bray F, Ferlay J, Soerjomataram I, Siegel RL, Torre LA, Jemal A. Global cancer statistics 2018: GLOBOCAN estimates of incidence and mortality worldwide for 36 cancers in 185 countries. CA Cancer J Clin. 2018;68:394–424. - PubMed
-
- Kumar RV, Panwar D, Amirtham U, Premalata CS, Gopal C, Narayana SM, Patil Okaly GV, Lakshmaiah KC, Krishnamurthy S. Estrogen receptor, progesterone receptor, and human epidermal growth factor receptor-2 status in breast cancer: a retrospective study of 5436 women from a regional cancer center in South India. South Asian J Cancer. 2018;7:7–10. - PMC - PubMed
-
- Lee A, Djamgoz MBA. Triple negative breast cancer: emerging therapeutic modalities and novel combination therapies. Cancer Treat Rev. 2018;62:110–122. - PubMed
LinkOut - more resources
Full Text Sources
Molecular Biology Databases
Research Materials