. 2019 Apr 24:9:284.
doi: 10.3389/fonc.2019.00284. eCollection 2019.

The CXCR4-LASP1-eIF4F Axis Promotes Translation of Oncogenic Proteins in Triple-Negative Breast Cancer Cells

Affiliations

The CXCR4-LASP1-eIF4F Axis Promotes Translation of Oncogenic Proteins in Triple-Negative Breast Cancer Cells

Cory M Howard et al. Front Oncol. .

Abstract

Triple-negative breast cancer (TNBC) remains clinically challenging as effective targeted therapies are lacking. In addition, patient mortality mainly results from the metastasized lesions. CXCR4 has been identified to be one of the major chemokine receptors involved in breast cancer metastasis. Previously, our lab had identified LIM and SH3 Protein 1 (LASP1) to be a key mediator in CXCR4-driven invasion. To further investigate the role of LASP1 in this process, a proteomic screen was employed and identified a novel protein-protein interaction between LASP1 and components of eukaryotic initiation 4F complex (eIF4F). We hypothesized that activation of the CXCR4-LASP1-eIF4F axis may contribute to the preferential translation of oncogenic mRNAs leading to breast cancer progression and metastasis. To test this hypothesis, we first confirmed that the gene expression of CXCR4, LASP1, and eIF4A are upregulated in invasive breast cancer. Moreover, we demonstrate that LASP1 associated with eIF4A in a CXCL12-dependent manner via a proximity ligation assay. We then confirmed this finding, and the association of LASP1 with eIF4B via co-immunoprecipitation assays. Furthermore, we show that LASP1 can interact with eIF4A and eIF4B through a GST-pulldown approach. Activation of CXCR4 signaling increased the translation of oncoproteins downstream of eIF4A. Interestingly, genetic silencing of LASP1 interrupted the ability of eIF4A to translate oncogenic mRNAs into oncoproteins. This impaired ability of eIF4A was confirmed by a previously established 5'UTR luciferase reporter assay. Finally, lack of LASP1 sensitizes 231S cells to pharmacological inhibition of eIF4A by Rocaglamide A as evident through BIRC5 expression. Overall, our work identified the CXCR4-LASP1 axis to be a novel mediator in oncogenic protein translation. Thus, our axis of study represents a potential target for future TNBC therapies.

Keywords: CXCR4; LASP1; breast cancer; eIF4A1; eIF4B; eIF4F; protein translation.


Figures

Figure 1
Figure 1
The CXCR4-LASP1-eIF4A/B Axis is Upregulated in Breast Carcinoma Patients. Gene expression data was obtained and analyzed using Oncomine.com. Two representative datasets were selected. Box and whisker plots of the log2 median centered ratio (fold change) are shown for each. (A) Radvanyi Breast Invasive Ductal Carcinoma (n = 31 for CXCR4, LASP1, eIF4A, and CCND1. n = 28 for BIRC5 and ROCK1. n = 27 for MDM2) vs. Breast Tissue (n = 9 for CXCR4, LASP1, eIF4A, and CCND1. n = 2 for BIRC5. n = 5 for MDM2 and ROCK1). (B) Radvanyi Breast Invasive Lobular Carcinoma (n = 7 for CXCR4, LASP1, eIF4A, and CCND1. n = 2 for BIRC5. n = 6 for MDM2 and ROCK1) vs. Breast Tissue (n = 9 for CXCR4, LASP1, eIF4A, and CCND1. n = 2 for BIRC5. n = 5 for MDM2 and ROCK1). (C) TCGA Breast Invasive Ductal Carcinoma (n = 389) vs. Breast Tissue (n = 61). (D) TCGA Breast Invasive Lobular Carcinoma (n = 36) vs. Breast Tissue (n = 61). * Indicates p < 0.05 as evaluated by student's t-tests.
Figure 2
Figure 2
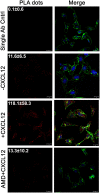
The LASP1-eIF4A interaction increases with CXCL12 stimulation in situ. The Proximity Ligation Assay (PLA) was used to visual the in situ interaction between LASP1 and eIF4A in 231S cells. Cells were stimulated with 20 nM CXCL12 for 5 min. 100 nM AMD3465 was added 30 min prior to stimulation. The single antibody control employs the PLA reaction using only the LASP1 antibody. Representative images of the PLA experiment are provided. Quantification indicates the average number of interactions/cell across multiple independent fields. (Single Ab Control: n = 39, -CXCL12: n = 46, +CXCL12: n = 29, +CXCL12/AMD3465: n = 15); Red-LASP1-eIF4A interaction, Green-phalloidin (actin), and Blue-DRAQ5 (nucleus); Scale bar−10 μm.
Figure 3
Figure 3
LASP1 interacts with the eIF4F complex in a CXCL12-dependent manner. (A) Co-immunoprecipitation assay of eIF4A and LASP1 in 231S cells following stimulation with 20 nM CXCL12 (n = 2). (B) Co-immunoprecipitation assay of eIF4B and LASP1 in 231S cells following stimulation with 10 nM CXCL12 (n = 3). (C) Co-immunoprecipitation assay of LASP1 and eIF4A/B following stimulation with 20 nM CXCL12 in 231S cells (n = 2). Fold change was calculated based off the densitometry ratio of co-immunoprecipitated/immunoprecipitated protein signal with 0 min. set to 1. (D–E) m7GTP pulldown assay in 231S cells following stimulation with 20 nM CXCL12 and 100 nM AMD3465 examining the interaction between: (D) LASP1-eIF4E (n = 3) and (E) eIF4G-eIF4E (n = 3). Fold change was calculated based off the densitometry ratio of co-precipitate (LASP1 or eIF4G)/precipitate (eIF4E) protein signal with 0 min. set to 1.
Figure 4
Figure 4
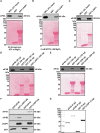
LASP1 directly interacts with both eIF4A and eIF4B. (A–C) 1 mg of 231S lysate was incubated with 1.5 nmoles of GST or GST-LASP1. (A) Presence of eIF4A was detected by Western blotting (n = 3). (B) 2 mM ATP and 3mM MgCl2 were exogenously added to the 231S lysate. Presence of eIF4A was then detected by Western blotting (n = 3). (C) Presence of eIF4B was detected by Western blotting (n = 3). (D–E) Purified eIF4A or eIF4B was incubated with 1.5 nmoles GST or GST-LASP1. Amounts of purified proteins are indicated in parenthesis. (D) Presence of eIF4B was detected by Western blotting (n = 3). (E) Presence of eIF4A was detected for by Western blotting (n = 3). Ponceau S stains of each blot are shown below to confirm loading of GST or GST-LASP1 following the elution from glutathione agarose beads. (F) Purified eIF4A and eIF4B were mixed with purified GST or GST-LASP1 in an equimolar ratio and in solution. Proteins complexes were then captured with glutathione beads and detected for by Western blotting (n = 1). (G) Imperial Protein Stain of purified eIF4A, eIF4B, GST, and GST-LASP1 (n = 1).
Figure 5
Figure 5
Activation of CXCR4 promotes phosphorylation of eIF4B, 4E-BP1, and PDCD4. 231S cells were stimulated with 10–20 nM CXCL12 for the indicated period. Phosphorylation status of (A) p-eIF4B S422 (B) p-PDCD4 S67 and (C) p-4E-BP1 Thr70 was determined by Western blotting (n = 3). Fold change indicates the densitometry ratio of (phospho-protein/total protein)/β-tubulin signal with 0 min. set to 1. (D) Status of p-eIF4B, p-PDCD4 S67, and p-4E-BP1 Thr70 in MCF7 vector, wild-type CXCR4, and CXCR4 ΔCTD cells (n = 3). Fold change indicates the densitometry ratio of (phospho-protein/total protein)/β-tubulin signal with MCF7 vector cells set to 1. (E) Proposed model of CXCR4 signaling and its effects on the eIF4F complex.
Figure 6
Figure 6
Activation of the CXCR4-LASP1 Axis enhances selective expression of eIF4A-dependent genes. (A) 231S LASP1 NS and KD cells were stimulated with 10–20 nM CXCL12. Expression levels of eIF4A-dependent genes were then determined by Western blotting (n = 3). Fold change indicates the densitometry ratio of protein signal/β-tubulin with 0 min. set to 1. (B) Stable knockdown of LASP1 leads to a reduced expression of eIF4A-dependent genes (n = 3). Fold change indicates the densitometry ratio of protein signal/β-tubulin with 231S LASP1 NS cells set to 1. (C) Knockdown of LASP1 does not significantly affect CCND1, MDM2, BIRC5, and ROCK1 mRNA levels (n = 3). Data was analyzed using the ΔΔCt method with β-tubulin primers as the control. Fold change was calculated with the 231S LASP1 NS cells set to 1. (D) Endogenous expression levels of BIRC5, MDM2, and ROCK1 in MCF7 Vector, Wild-type CXCR4, and CXCR4 ΔCTD cells (n = 3). Fold change indicates the densitometry ratio of protein signal/β-tubulin with MCF7 vector cells set to 1. (E) 231S LASP1 KD cells have a reduced capacity to translate genes harboring a complex 5′UTR as indicated by the GQ 5′UTR luciferase assay (n = 3). (F) GQ 5′UTR luciferase assay in 293-HA-CXCR4 CRISPR Control and LASP1 KO cells (n = 3). Fold change indicates the luminescent ratio of luciferase/renilla (transfection control) with CMV set to 1. (G) Western blot analysis of LASP1 protein levels in 293-HA-CXCR4 CRISPR Control and LASP1 KO cells (n = 3). * Indicates p < 0.05 as evaluated by unpaired student's t-tests.
Figure 7
Figure 7
Stable knockdown of LASP1 sensitizes TNBC cells to inhibition by Rocaglamide A. (A) Representative images of 231S LASP1 NS and KD cells incubated with various concentrations of Rocaglamide A at 0 and 36-h time points. (B) Percent inhibition of 231S LASP1 NS and KD cells following 36-h RocA drug treatment (n = 3). Percent inhibition was calculated in reference to the fold difference of percent confluence between Rocaglamide A treated cells and the DMSO control for each cell type at 36 h. (C) Percent viability in 231S LASP1 NS and KD cells following Rocaglamide A drug treatment. Data is reflective of absorbance at 450 nm with the DMSO condition set to 100% for each cell type. (D) Western blotting of BIRC5 in LASP1 NS/KD cells following 24 h of Rocaglamide A incubation (n = 3). Fold change indicates the densitometry ratio of BIRC5 signal/β-tubulin with the 231S LASP1 NS DMSO condition set to 1. * Indicates p < 0.05 as evaluated by student's t-tests.
Figure 8
Figure 8
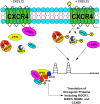
Proposed Model of the CXCR4-LASP1-eIF4F Axis. An illustration of CXCR4 and its relation to the eIF4F complex upon stimulation with CXCL12. This relationship is occurring through two distinctive mechanisms. First, LASP1 dissociates from CXCR4 and directly interacts with eIF4A and eIF4B. Second, phosphorylation of PDCD4, 4E-BP1, and eIF4B is promoted through G protein-coupled receptor signaling. As a result, both complex formation increases along with the function of eIF4A. Consequently, the translation of oncogenic proteins is promoted.

Similar articles

Cited by

References

    1. Siegel RL, Miller KD, Jemal A. Cancer statistics, 2019. CA Cancer J Clin. (2019) 69:7–34. 10.3322/caac.21551 - DOI - PubMed
    1. Valent P, Bonnet D, Wohrer S, Andreeff M, Copland M, Chomienne C, et al. . Heterogeneity of neoplastic stem cells: theoretical, functional, and clinical implications. Cancer Res. (2013) 73:1037–45. 10.1158/0008-5472.CAN-12-3678 - DOI - PubMed
    1. Brooks MD, Burness ML, Wicha MS. Therapeutic implications of cellular heterogeneity and plasticity in breast cancer. Cell Stem Cell. (2015) 17:260–71. 10.1016/j.stem.2015.08.014 - DOI - PMC - PubMed
    1. Muller A, Homey B, Soto H, Ge N, Catron D, Buchanan ME, et al. . Involvement of chemokine receptors in breast cancer metastasis. Nature. (2001) 410:50–6. 10.1038/35065016 - DOI - PubMed
    1. Goldberg-Bittman L, Neumark E, Sagi-Assif O, Azenshtein E, Meshel T, Witz IP, et al. . The expression of the chemokine receptor CXCR3 and its ligand, CXCL10, in human breast adenocarcinoma cell lines. Immunol Lett. (2004) 92:171–8. 10.1016/j.imlet.2003.10.020 - DOI - PubMed