

Overexpression of ASPM, CDC20, and TTK Confer a Poorer Prognosis in Breast Cancer Identified by Gene Co-expression Network Analysis
- PMID: 31106147
- PMCID: PMC6492458
- DOI: 10.3389/fonc.2019.00310
Overexpression of ASPM, CDC20, and TTK Confer a Poorer Prognosis in Breast Cancer Identified by Gene Co-expression Network Analysis
Abstract
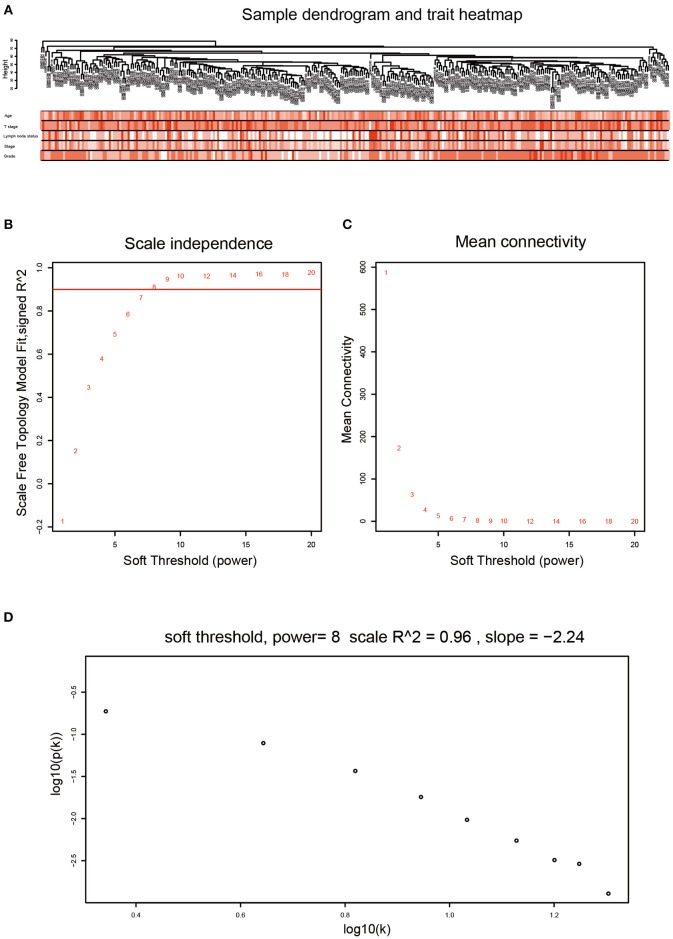
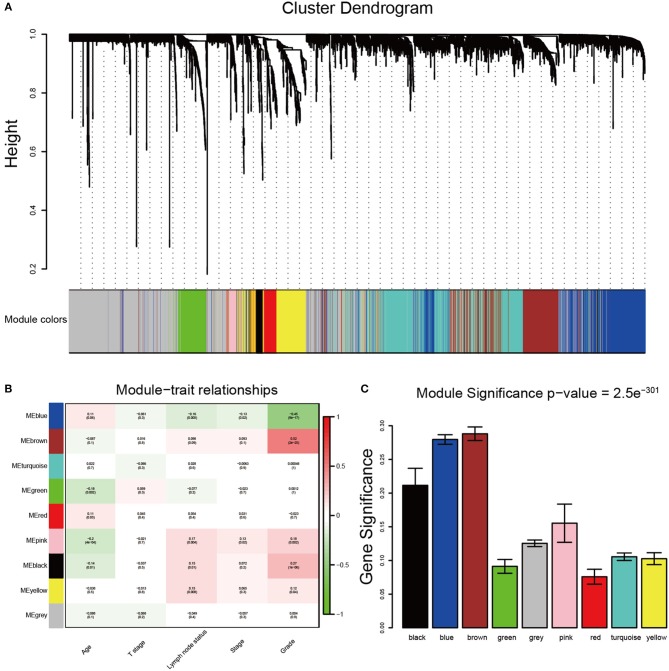
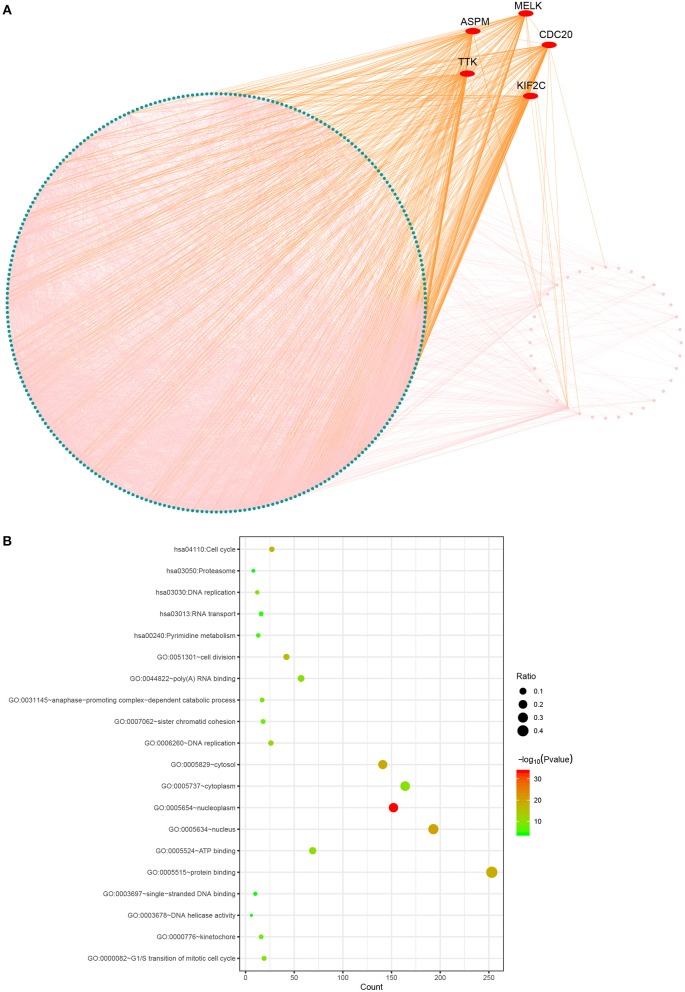
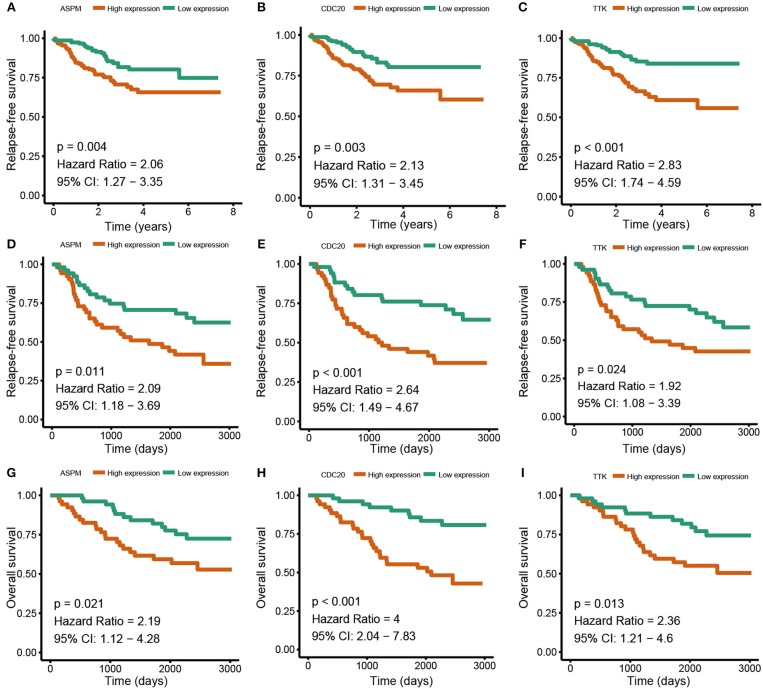
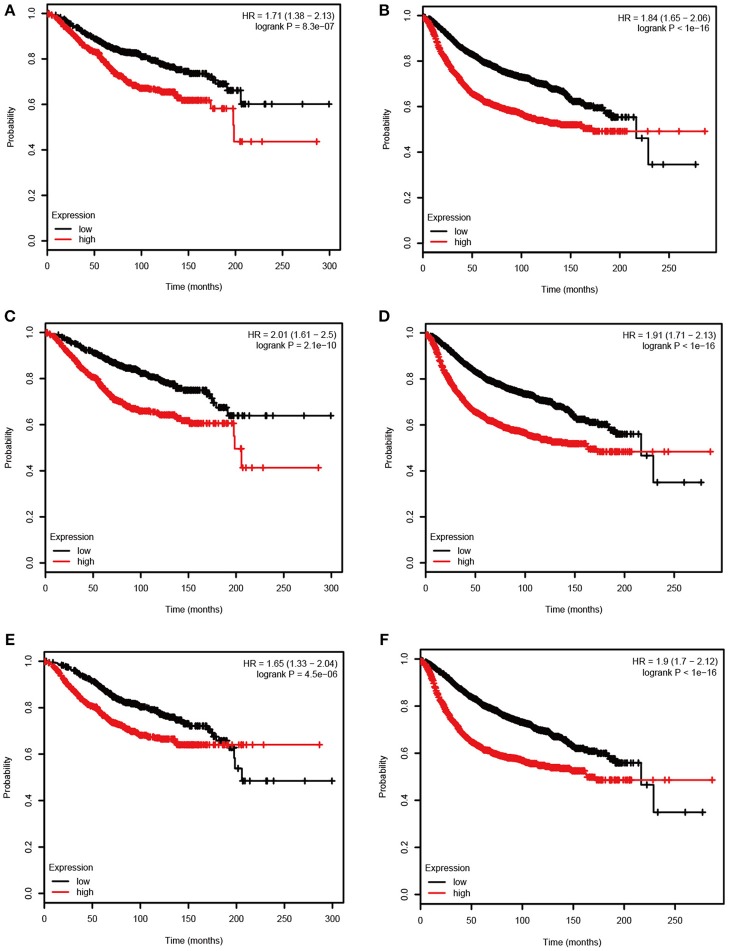
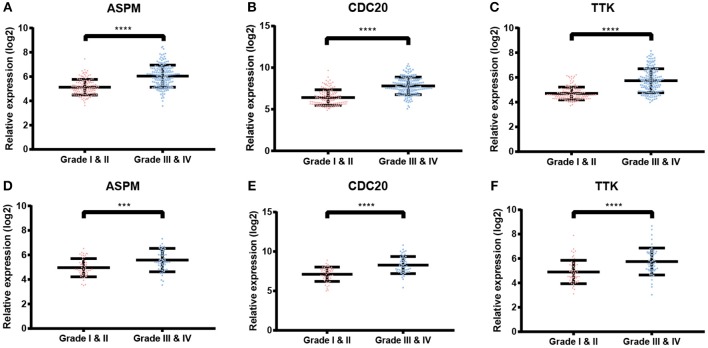
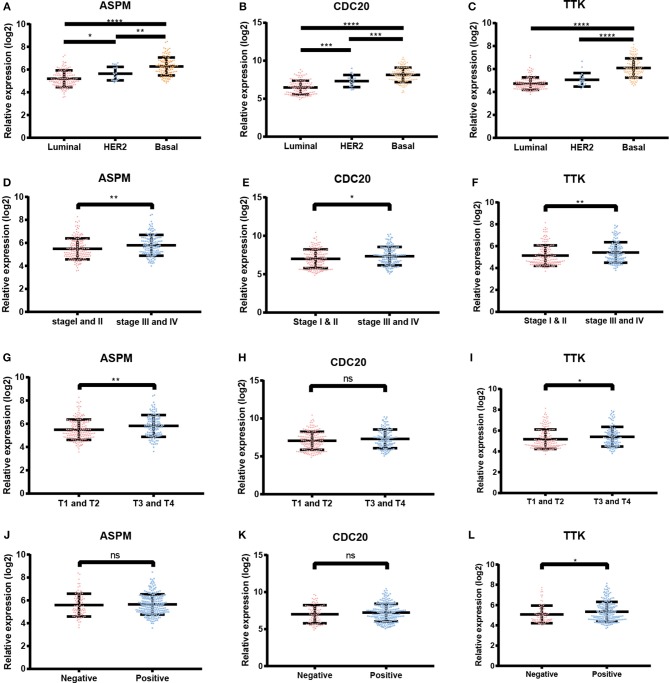
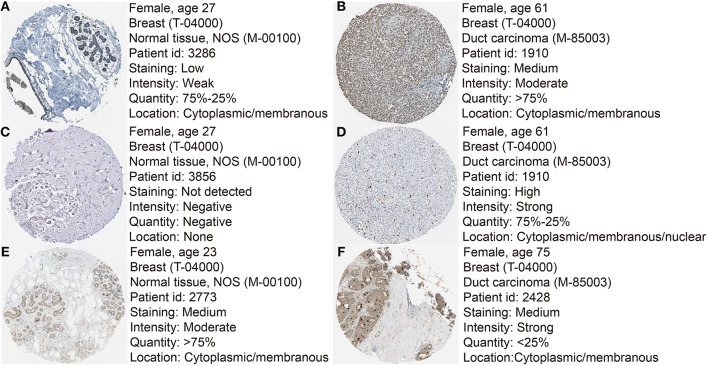
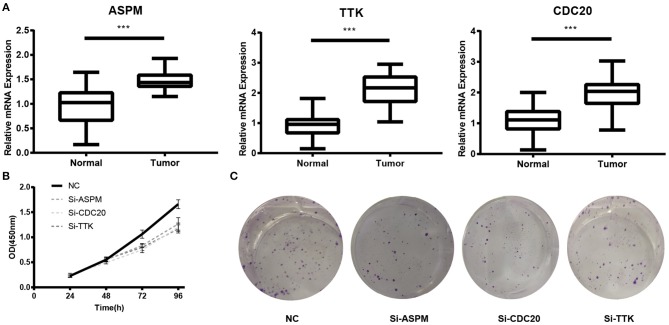
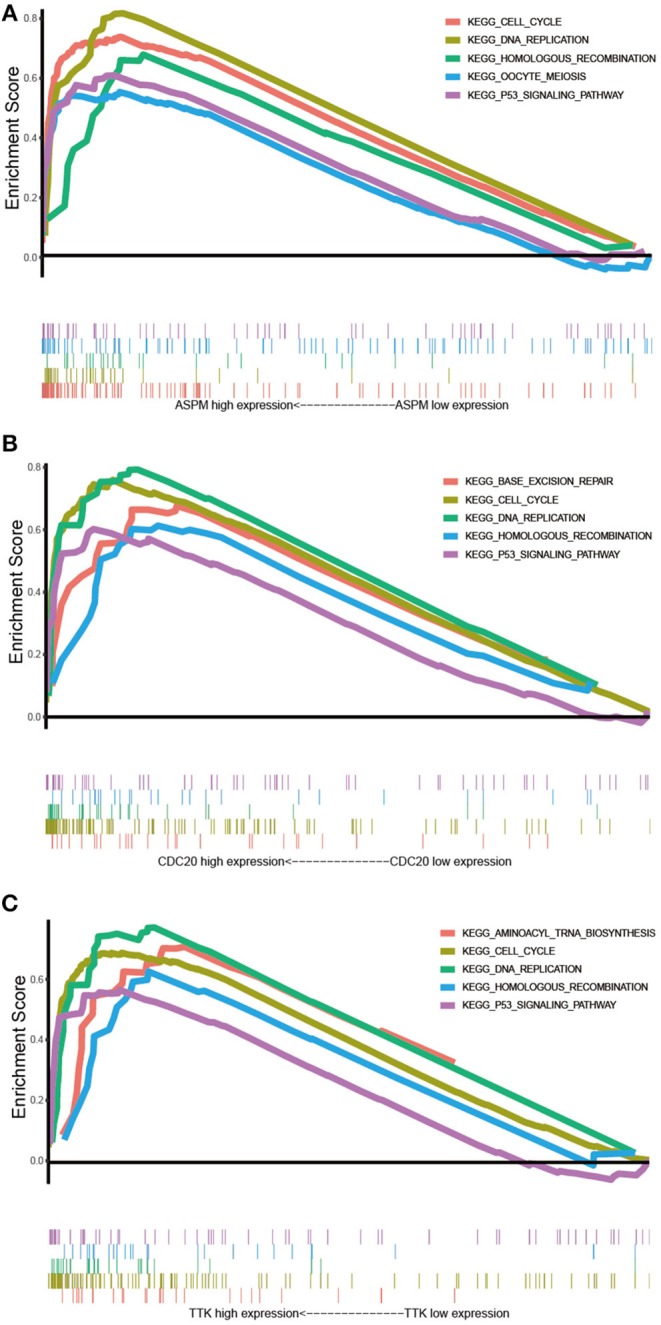
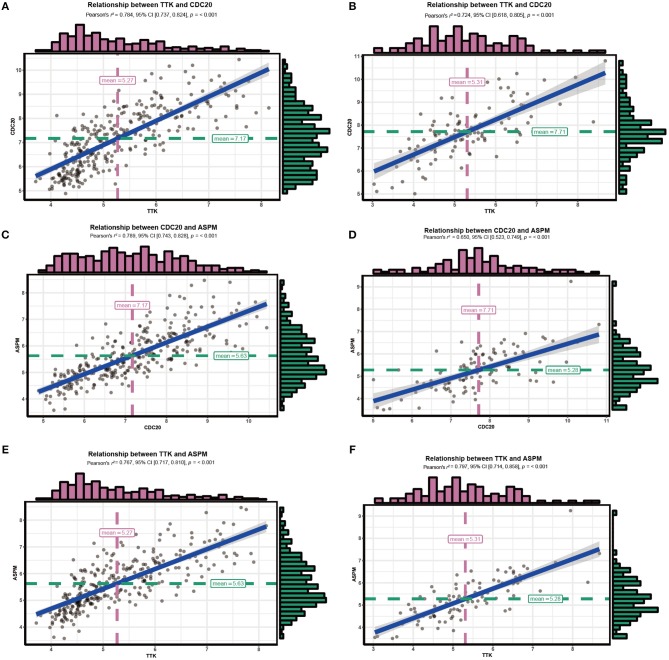
Breast cancer is one of the most common malignancies among females, and its prognosis is affected by a complex network of gene interactions. In this study, we constructed free-scale gene co-expression networks using weighted gene co-expression network analysis (WGCNA). The gene expression profiles of GSE25055 were downloaded from the Gene Expression Omnibus (GEO) database to identify potential biomarkers associated with breast cancer progression. GSE42568 was downloaded for validation. A total of 9 modules were established via the average linkage hierarchical clustering. We identified 3 hub genes (ASPM, CDC20, and TTK) in the significant module (R 2 = 0.52), which were significantly correlated with poor prognosis both in test and validation datasets. In the datasets GSE25055 and GSE42568, higher expression levels of ASPM, CDC20, and TTK correlated with advanced tumor grades. Immunohistochemistry data from the Human Protein Atlas also demonstrated that their protein levels were higher in tumor samples. According to gene set enrichment analysis, 4 commonly enriched pathways were identified: cell cycle pathway, DNA replication pathway, homologous recombination pathway, and P53 signaling pathway. In addition, strong correlations were found among their expression levels. In conclusion, our WGCNA analysis identified candidate prognostic biomarkers for further basic and clinical researches.
Keywords: ASPM; CDC20; TTK; WGCNA; breast cancer; prognosis.
Figures
Similar articles
-
Identification and validation of real hub genes in hepatocellular carcinoma based on weighted gene co-expression network analysis.Cancer Biomark. 2022;35(2):227-243. doi: 10.3233/CBM-220151. Cancer Biomark. 2022. PMID: 36120772
-
Weighted gene co-expression network analysis of the association between upregulated AMD1, EN1 and VGLL1 and the progression and poor prognosis of breast cancer.Exp Ther Med. 2021 Sep;22(3):1030. doi: 10.3892/etm.2021.10462. Epub 2021 Jul 18. Exp Ther Med. 2021. PMID: 34373716 Free PMC article.
-
Prognostic Genes of Breast Cancer Identified by Gene Co-expression Network Analysis.Front Oncol. 2018 Sep 11;8:374. doi: 10.3389/fonc.2018.00374. eCollection 2018. Front Oncol. 2018. PMID: 30254986 Free PMC article.
-
Identification and Validation of Hub Genes Associated with Bladder Cancer by Integrated Bioinformatics and Experimental Assays.Front Oncol. 2021 Dec 20;11:782981. doi: 10.3389/fonc.2021.782981. eCollection 2021. Front Oncol. 2021. PMID: 34988018 Free PMC article.
-
Weighted gene correlation network analysis identifies RSAD2, HERC5, and CCL8 as prognostic candidates for breast cancer.J Cell Physiol. 2020 Jan;235(1):394-407. doi: 10.1002/jcp.28980. Epub 2019 Jun 21. J Cell Physiol. 2020. PMID: 31225658
Cited by
-
Construction of a Co-Expression Network for lncRNAs and mRNAs Related to Urothelial Carcinoma of the Bladder Progression.Front Oncol. 2022 Feb 25;12:835074. doi: 10.3389/fonc.2022.835074. eCollection 2022. Front Oncol. 2022. PMID: 35280820 Free PMC article.
-
The neurological and non-neurological roles of the primary microcephaly-associated protein ASPM.Front Neurosci. 2023 Aug 3;17:1242448. doi: 10.3389/fnins.2023.1242448. eCollection 2023. Front Neurosci. 2023. PMID: 37599996 Free PMC article. Review.
-
Comprehensively analyzing the genetic alterations, and identifying key genes in ovarian cancer.Oncol Res. 2023 Apr 10;31(2):141-156. doi: 10.32604/or.2023.028548. eCollection 2023. Oncol Res. 2023. PMID: 37304238 Free PMC article.
-
Differentially expressed discriminative genes and significant meta-hub genes based key genes identification for hepatocellular carcinoma using statistical machine learning.Sci Rep. 2023 Mar 7;13(1):3771. doi: 10.1038/s41598-023-30851-1. Sci Rep. 2023. PMID: 36882493 Free PMC article.
-
Identification of crucial genes correlated with esophageal cancer by integrated high-throughput data analysis.Medicine (Baltimore). 2020 May;99(20):e20340. doi: 10.1097/MD.0000000000020340. Medicine (Baltimore). 2020. PMID: 32443386 Free PMC article.
References
LinkOut - more resources
Full Text Sources
Other Literature Sources
Research Materials
Miscellaneous