. 2019 Jan;1(1):158-171.
doi: 10.1038/s42255-018-0011-x. Epub 2019 Jan 7.

Mitochondrial complex III is necessary for endothelial cell proliferation during angiogenesis

Affiliations

Mitochondrial complex III is necessary for endothelial cell proliferation during angiogenesis

Lauren P Diebold et al. Nat Metab. 2019 Jan.

Abstract

Endothelial cells (ECs) require glycolysis for proliferation and migration during angiogenesis; however, the necessity for the mitochondrial respiratory chain during angiogenesis is not known. Here we report that inhibition of respiratory chain complex III impairs proliferation, but not migration of ECs in vitro by decreasing the NAD+/NADH ratio. To determine whether mitochondrial respiration is necessary for angiogenesis in vivo, we conditionally ablate a subunit of the respiratory chain complex III (QPC) in ECs. Loss of QPC decreases respiration, resulting in diminished EC proliferation, and impairment in retinal and tumor angiogenesis. Loss of QPC does not decrease genes associated with anabolism or nucleotides levels in ECs, but diminishes amino acid levels. Our findings indicate that mitochondrial respiration is necessary for angiogenesis, and that the primary role of mitochondria in ECs is to serve as biosynthetic organelles for cell proliferation.


Figures

Figure 1:
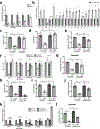
Figure 1:. Mitochondrial complex III is required for endothelial cell proliferation in vitro
a. Relative basal and coupled oxygen consumption rate (OCR) of control (Ct) or antimycin A (Anti) treated HUVECs, measured after 2 hours treatment. Values are normalized to control mean (n=4 biologically independent experiments). b. Basal and maximum extracellular acidification rate (ECAR) of Ct or Anti treated HUVECs, measured after 2 hours treatment (n=4 biologically independent experiments). c. Cell viability (% Dapi negative cells) of Ct or Anti treated HUVECs, measured after 96 hours treatment (n=4 biologically independent experiments). d. Representative images of Ct or Anti treated HUVECs in a sprouting assay after 24 hours. Scale bar represents 50μm. Repeated 6 times with similar results. e. Quantification of relative sprout length of Ct or Anti treated HUVECs after 24 hours. Values are normalized to control mean (n=6 biologically independent samples). f. Quantification of the average number of sprouts per spheroid of Ct or Anti treated HUVECs after 24 hours. (n=6 biologically independent samples). g. Relative wound density % over time in a scratch wound migration assay in Ct or Anti treated HUVECs (Ct: n=15; Anti: n=7 biologically independent samples). h. Relative cell number in Ct or Anti treated HUVECs at 0, 24, 48, 72, and 96 hours. Cell number relative to number of cells plated on day 0 (n=5 biologically independent experiments). HUVECs were treated with 25nM antimycin A. In sprouting and migration assays, media contained 2ug/mL mitomycin C to inhibit proliferation. Data represents mean +/− SEM and were analyzed with a two-tailed t-test (*p<0.05, **p<0.01, NS=not significant).
Figure 2:
Figure 2:. Mitochondrial complex III maintains NAD+/NADH ratio, necessary for endothelial cell proliferation a-b.
Relative abundance of TCA cycle (a), and amino acid (b) metabolites from control (Ct) or antimycin A (Anti) treated HUVECs, after 24 hours treatment. Values are normalized to control mean (n=6 biologically independent experiments). c. Relative oxygen consumption (OCR) in empty vector (EV)-GFP or AOX-GFP expressing HUVECs, Ct or Anti treated for 2 hours (representative of n=3 independent experiments). d. Ratio of NAD+/NADH in EV-GFP or AOX-GFP expressing HUVECs, Ct or Anti treated for 4 hours (n=4 biologically independent experiments). e. Relative cell number after 72 hours proliferation in EV-GFP or AOX-GFP expressing HUVECs, Ct or Anti treated (n=5 biologically independent experiments). f-g. Relative abundance of TCA cycle metabolites (f), and aspartate (g) in EV-GFP or AOX-GFP expressing HUVECs, Ct or Anti treated for 24 hours. Values are normalized to control mean (n=6 biologically independent experiments). h. Relative OCR in EV-RFP or LbNOX-RFP expressing HUVECs, Ct or Anti treated for 2 hours (representative of n=3 independent experiments). i. Ratio of NAD+/NADH in EV-RFP or LbNOX-RFP expressing HUVECs, Ct or Anti treated for 4 hours (n=4 biologically independent experiments). j. Relative cell number after 72 hours proliferation in EV-RFP or LbNOX-RFP expressing HUVECs, Ct or Anti treated (n=6 biologically independent experiments ). k-l. Relative abundance of TCA cycle metabolites (k), and aspartate (l) in EV-RFP or LbNOX-RFP expressing HUVECs, Ct or Anti treated for 24 hours. Values are normalized to control mean. (n=6 biologically independent experiments). HUVECs were treated with 25nM antimycin A. Data represents mean +/− SEM and were analyzed using one or two-way ANOVA and Tukey’s multiple comparisons test (*p<0.05, **p<0.01, NS=not significant).
Figure 3:
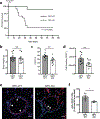
Figure 3:. Mitochondrial complex III respiration in ECs is required for post-natal retinal angiogenesis
a. Representative images QPC-WT and –KO retinas stained with isolectin-B4 (IB4) at 10× original magnification. Top panels: Dotted circle represents the QPC-WT radial expansion. Scale bars represents 500μm. Bottom panels: zoomed image representing white box from top panel. Scale bar represents 100μm. b. Quantification of radial expansion in QPC-WT and –KO retinas (WT: n=6; KO: n=6 mice). c. Quantification of the number of branchpoints per mm2 in QPC-WT and –KO retinas (WT: n=6; KO: n=6 mice). d. Representative images of QPC-WT and -KO retinas stained with IB4 (blue) and phospo-histone 3 (pH3) (yellow) taken at 40× magnification. Scale bars represent 50μm. e. Quantification of pH3+/IB4+ ECs per 100mm2 (WT: n=8; KO: n=7 mice). f. Representative images of filopodia from QPC-WT and –KO retinas stained with IB4 taken at 100× magnification. Scale bars represent 20μm. g. Quantification of the number of filopodia per 100μm at the outer retinal edge. (WT: n=7; KO: n=8 mice). Data represent whole-mounted retinas from QPC-WT and –KO post-natal day 7 (P7) pups treated with tamoxifen (P0-P4). Data represents mean +/− SEM and were analyzed with a two-tailed t-test (*p<0.05, **p<0.01, NS=not significant).
Figure 4:
Figure 4:. Mitochondrial complex III respiration in ECs is necessary for developmental angiogenesis
a. Survival curve of QPC-WT and -KO pups treated with tamoxifen (P0-P4) (WT: n=10; KO: n=15 mice). b. Body weight of QPC-WT and -KO P15 pups (WT: n=11; KO: n=11). c-d. Percentage of CD31+ cells (c), and total number of CD31+ cells (d) from the lung of QPC-WT and -KO P15 pups (WT: n=11; KO: n=11 mice). e. Representative images of QPC-WT and –KO lung vessels from P15 pups. Vessels stained with CD31 (red), proliferating cells stained with phospho-histone 3 (pH3) (green) and nuclei stained with DAPI (blue), taken at 60× magnification. Scale bars represent 25μm. White arrows represent pH3+/CD31+ cells. f. Quantification of the number of pH3+/CD31+ cells as a percentage of the total number of CD31+ cells counted per vessel in QPC-WT and –KO lung sections (WT: n=5; KO: n=5 mice). Bar graphs represent mean +/− SEM and were analyzed with a two-tailed t-test. Survival curve was analyzed using a Log-rank (Mantel-Cox) test. (*p<0.05, **p<0.01, NS=not significant).
Figure 5:
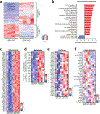
Figure 5:. Loss of mitochondrial complex III function in ECs increases anabolic-associated gene expression
a. Heat map of RNA sequencing data representing significantly upregulated (237) and downregulated (142) genes from QPC-WT and -KO P15 lung ECs from pups treated with tamoxifen (P0-P4) (FDR ≤ 0.01). b. Gene set enrichment analysis showing top gene signatures upregulated (red) or downregulated (blue) from QPC-WT and -KO P15 lung ECs (NOM p-value ≤ 0.05). c. Heat map of RNA sequencing data showing significantly upregulated ribosomal genes from QPC-KO versus -WT P15 lung ECs (FDR ≤ 0.01). d. Heatmap of RNA sequencing data showing significantly upregulated metabolic genes from QPC-WT and –KO P15 lung ECs (FDR ≤ 0.01). e. Heat map of RNA sequencing data showing oxidative phosphorylation (OxPhos) genes from QPC-WT and -KO P15 lung ECs. f. Heat map of RNA sequencing data showing angiogenic signaling gene expression. * represents genes that are significantly differentially expressed in QPC-KO vs -WT P15 lung ECs (FDR ≤ 0.01). Data shown in heat maps is representative of the z-score. WT: n=4; KO: n=4 mice.
Figure 6:
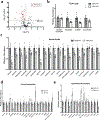
Figure 6:. Mitochondrial complex III in ECs is necessary to maintain amino acid levels in vivo
a. Volcano plot representing metabolites that are over or under represented in QPC-KO P15 lung ECs versus –WT from pups treated with tamoxifen (P0-P4). Red triangles represent amino acid metabolites (WT: n=7; KO: n=7 mice). b-e. Relative abundance of TCA cycle (b), amino acid (c), purine nucleotide (d), and pyrimidine nucleotide (e) metabolites from P15 QPC-WT and –KO lung ECs (WT: n=7; KO: n=7 mice). Data are normalized to QPC-WT mean. Bar graphs represent mean +/− SEM and were analyzed using the Two-stage linear step-up procedure of Benjamini, Krieger and Yekutieli, with FDR<0.1. (*p<0.05, **p<0.01, NS=not significant).
Figrue 7:
Figrue 7:. Mitochondrial complex III respiration in ECs is required for tumor angiogenesis
a. qRT-PCR showing relative QPC expression from QPC-WT and –KO lung ECs from adult mice (WT: n=3; KO: n=4). b. Relative basal oxygen consumption (OCR) from QPC-WT and –KO lung ECs (Graph represents WT: n=7 and KO: n=8 technical replicates from WT: n=2; KO: n=2 mice). Error bars represent SEM between technical replicates. c. Growth curve of subcutaneous B16-F10 melanoma tumors in QPC-WT and -KO mice (WT: n=20; KO: n=15 mice). d. Tumor weight (mg) of subcutaneous B16-F10 melanoma tumors from QPC-WT and -KO mice measured 21 days after injection (WT: n=20; KO: n=15 mice). e. Representative images of QPC-WT and -KO B16-F10 melanoma tumor sections. Vessels stained with CD31 (red) and nuclei stained with DAPI (blue), taken at 20× magnification. Scale bar represents 100μm. f. Quantification of the number of vessels per 100mm2 in QPC-WT and –KO tumor sections (WT: n=12; KO: n=12 mice). g. Representative images of QPC-WT and –KO B16-F10 melanoma tumor sections. Vessels stained with CD31 (red), proliferating cells stained with phospho-histone 3 (pH3) (green) and nuclei stained with DAPI (blue), taken at 60× magnification. Scale bars represent 25μm. White arrows represent pH3+/CD31+ cells. h. Quantification of the number of pH3+/CD31+ cells as a percentage of the total number of CD31+ cells counted per field in QPC-WT and –KO tumor sections (WT: n=12; KO: n=12 mice). Mice were fed tamoxifen chow for 2 weeks to induce loss of QPC prior to tumor injections and remained on tamoxifen chow for the duration of the experiment. Data represents mean +/− SEM and were analyzed with a two-tailed t-test (*p<0.05, **p<0.01, NS=not significant).

Similar articles

Cited by

References

    1. Teuwen L-A, Geldhof V & Carmeliet P How glucose, glutamine and fatty acid metabolism shape blood and lymph vessel development. Dev. Biol. (2017). doi:10.1016/j.ydbio.2017.12.001 - DOI - PubMed
    1. De Bock K et al. Role of PFKFB3-driven glycolysis in vessel sprouting. Cell 154, 651–663 (2013). - PubMed
    1. Parra-Bonilla G, Alvarez DF, Al-Mehdi A-B, Alexeyev M & Stevens T Critical role for lactate dehydrogenase A in aerobic glycolysis that sustains pulmonary microvascular endothelial cell proliferation. Am. J. Physiol. Lung Cell. Mol. Physiol. 299, L513–522 (2010). - PMC - PubMed
    1. Yeh W-L, Lin C-J & Fu W-M Enhancement of glucose transporter expression of brain endothelial cells by vascular endothelial growth factor derived from glioma exposed to hypoxia. Mol. Pharmacol. 73, 170–177 (2008). - PubMed
    1. Cantelmo AR et al. Inhibition of the Glycolytic Activator PFKFB3 in Endothelium Induces Tumor Vessel Normalization, Impairs Metastasis, and Improves Chemotherapy. Cancer Cell 30, 968–985 (2016). - PMC - PubMed

Publication types

LinkOut - more resources