

Lung Computational Models and the Role of the Small Airways in Asthma
- PMID: 31106566
- PMCID: PMC6794099
- DOI: 10.1164/rccm.201812-2322OC
Lung Computational Models and the Role of the Small Airways in Asthma
Abstract
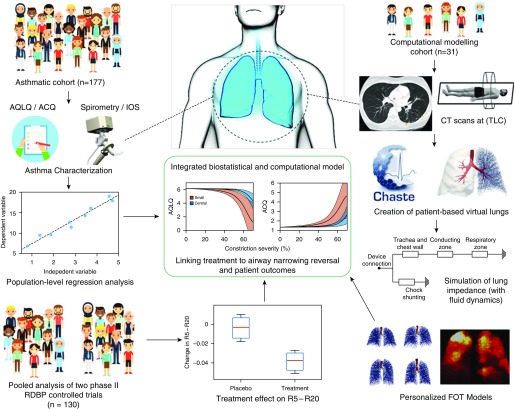
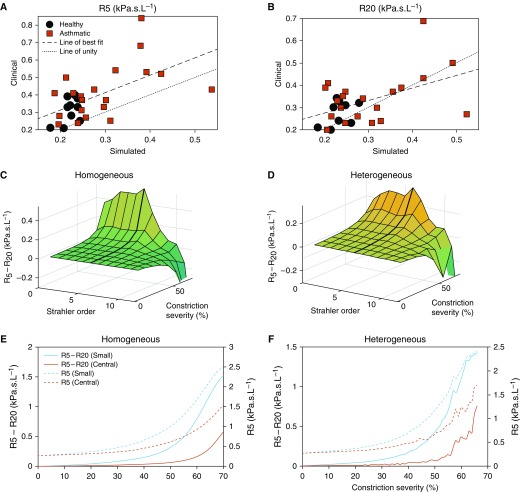
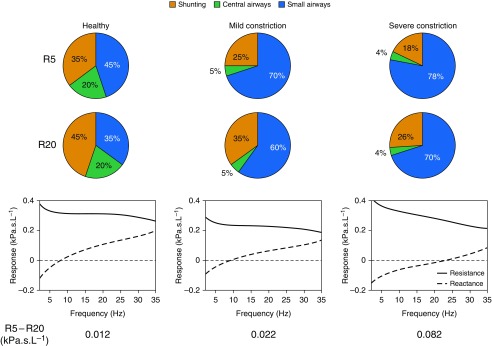
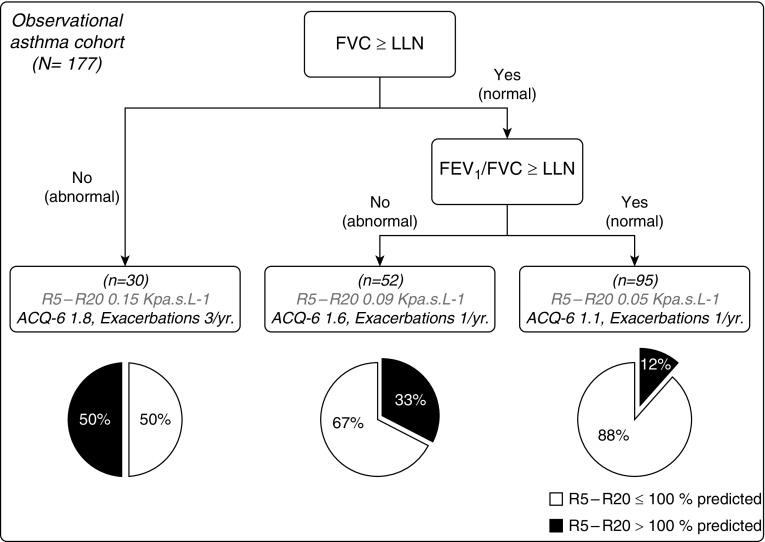
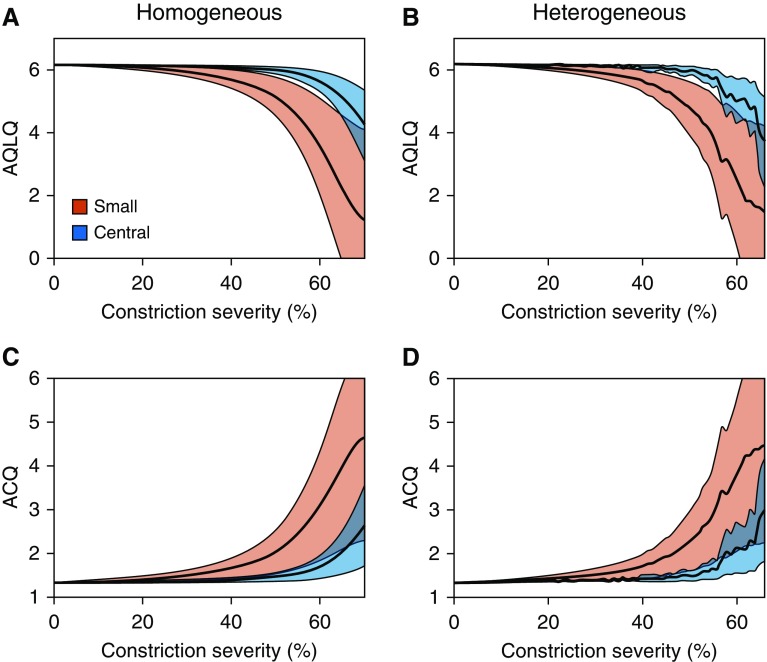
Rationale: Asthma is characterized by disease within the small airways. Several studies have suggested that forced oscillation technique-derived resistance at 5 Hz (R5) - resistance at 20 Hz (R20) is a measure of small airway disease; however, there has been limited validation of this measurement to date.Objectives: To validate the use of forced oscillation R5 - R20 as a measure of small airway narrowing in asthma, and to investigate the role that small airway narrowing plays in asthma.Methods: Patient-based complete conducting airway models were generated from computed tomography scans to simulate the impact of different degrees of airway narrowing at different levels of the airway tree on forced oscillation R5 - R20 (n = 31). The computational models were coupled with regression models in an asthmatic cohort (n = 177) to simulate the impact of small airway narrowing on asthma control and quality of life. The computational models were used to predict the impact on small airway narrowing of type-2 targeting biologics using pooled data from two similarly design randomized, placebo-controlled biologic trials (n = 137).Measurements and Main Results: Simulations demonstrated that narrowing of the small airways had a greater impact on R5 - R20 than narrowing of the larger airways and was associated (above a threshold of approximately 40% narrowing) with marked deterioration in both asthma control and asthma quality of life, above the minimal clinical important difference. The observed treatment effect on R5 - R20 in the pooled trials equated to a predicted small airway narrowing reversal of approximately 40%.Conclusions: We have demonstrated, using computational modeling, that forced oscillation R5 - R20 is a direct measure of anatomical narrowing in the small airways and that small airway narrowing has a marked impact on both asthma control and quality of life and may be modified by biologics.
Keywords: asthma; forced oscillation technique; imaging; integrative modelling; small airways.
Figures
Comment in
-
Finally More Direct Evidence That Impulse Oscillometry Measures Small Airway Disease.Am J Respir Crit Care Med. 2019 Oct 15;200(8):951-952. doi: 10.1164/rccm.201905-1037ED. Am J Respir Crit Care Med. 2019. PMID: 31188643 Free PMC article. No abstract available.
-
Reply to Lipworth and Kuo: Resistance Heterogeneity and Small Airway Asthma Phenotype.Am J Respir Crit Care Med. 2019 Dec 1;200(11):1442. doi: 10.1164/rccm.201906-1274LE. Am J Respir Crit Care Med. 2019. PMID: 31339329 Free PMC article. No abstract available.
-
Resistance Heterogeneity and Small Airway Asthma Phenotype.Am J Respir Crit Care Med. 2019 Dec 1;200(11):1441-1442. doi: 10.1164/rccm.201905-1060LE. Am J Respir Crit Care Med. 2019. PMID: 31339343 Free PMC article. No abstract available.
References
-
- Contoli M, Kraft M, Hamid Q, Bousquet J, Rabe KF, Fabbri LM, et al. Do small airway abnormalities characterize asthma phenotypes? In search of proof. Clin Exp Allergy. 2012;42:1150–1160. - PubMed
-
- Lipworth B, Manoharan A, Anderson W. Unlocking the quiet zone: the small airway asthma phenotype. Lancet Respir Med. 2014;2:497–506. - PubMed
-
- Usmani OS, Singh D, Spinola M, Bizzi A, Barnes PJ. The prevalence of small airways disease in adult asthma: a systematic literature review. Respir Med. 2016;116:19–27. - PubMed
-
- Hamid Q, Song Y, Kotsimbos TC, Minshall E, Bai TR, Hegele RG, et al. Inflammation of small airways in asthma. J Allergy Clin Immunol. 1997;100:44–51. - PubMed
-
- Hyde DM, Hamid Q, Irvin CG. Anatomy, pathology, and physiology of the tracheobronchial tree: emphasis on the distal airways. J Allergy Clin Immunol. 2009;124(Suppl):S72–S77. - PubMed
Publication types
MeSH terms
Supplementary concepts
LinkOut - more resources
Full Text Sources
Other Literature Sources
Medical
