. 2019 Sep 24;70(18):4721-4736.
doi: 10.1093/jxb/erz239.

Genome-wide identification of GhAAI genes reveals that GhAAI66 triggers a phase transition to induce early flowering

Affiliations

Genome-wide identification of GhAAI genes reveals that GhAAI66 triggers a phase transition to induce early flowering

Ghulam Qanmber et al. J Exp Bot. .

Abstract

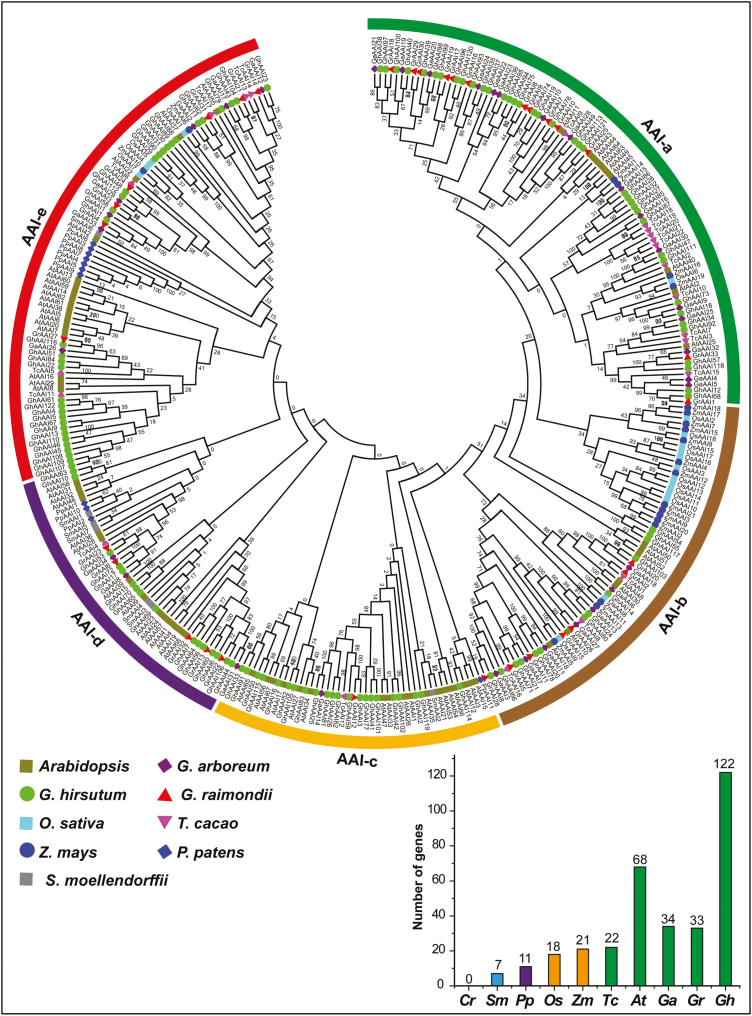
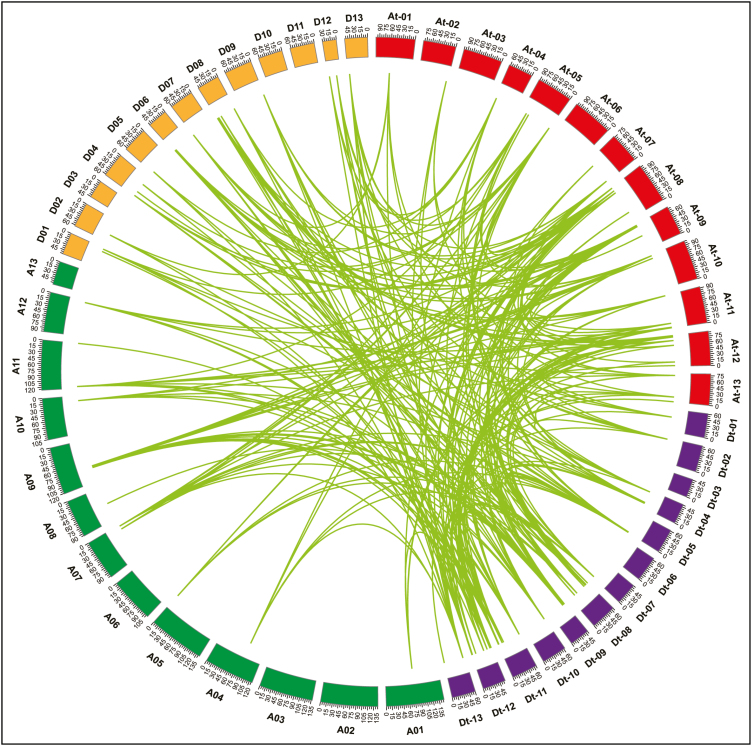
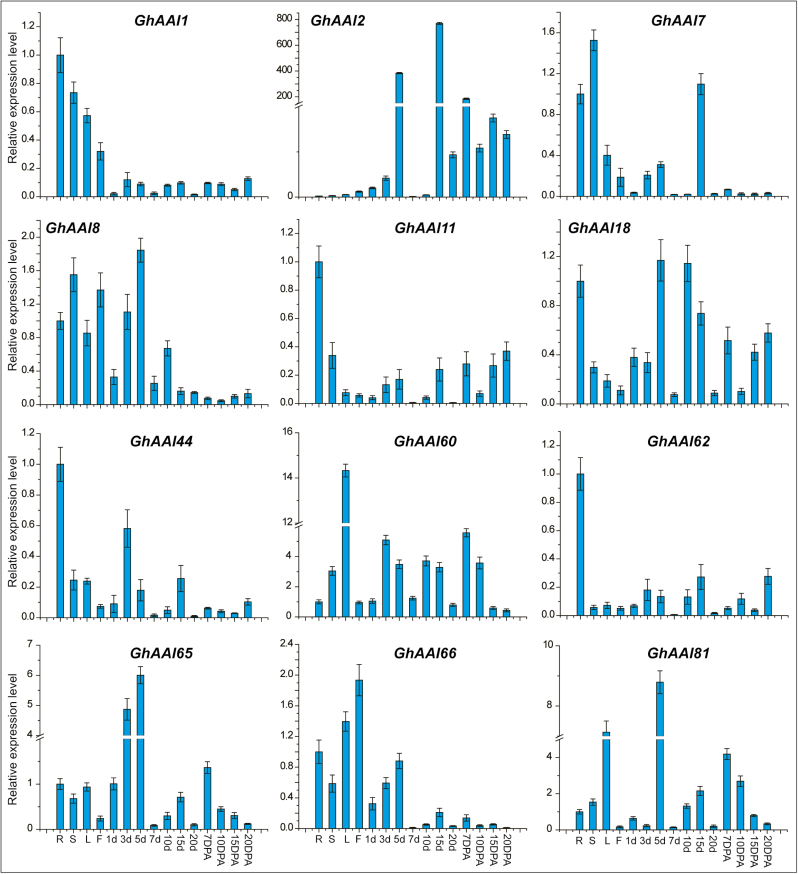
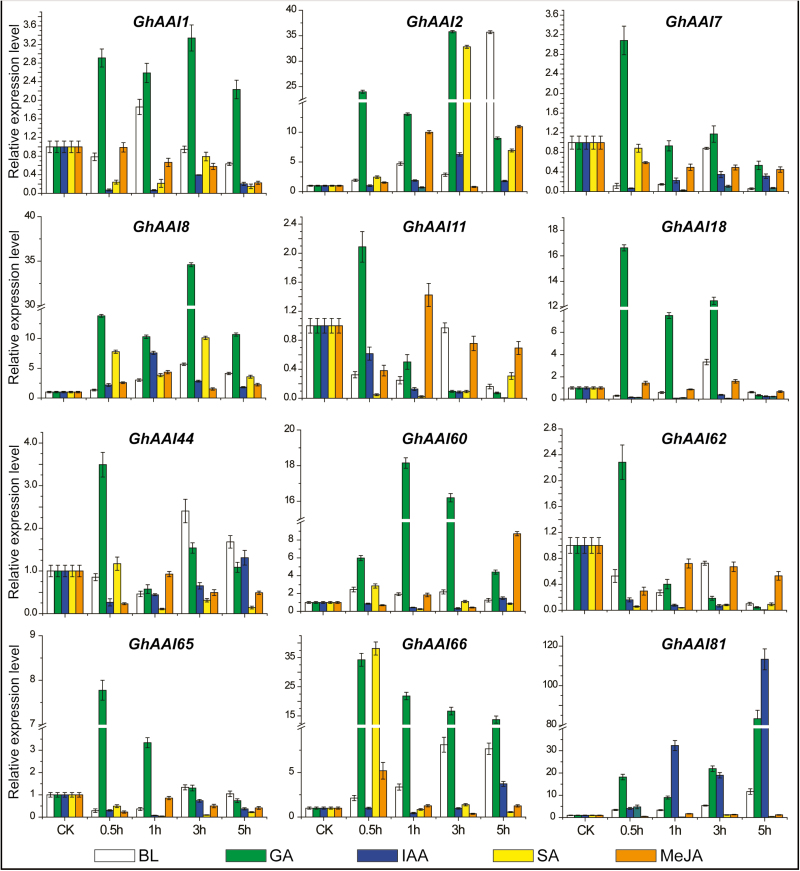
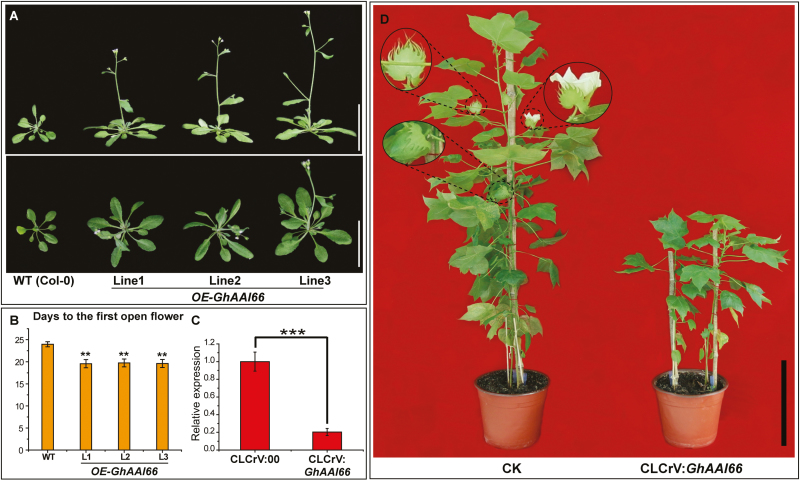
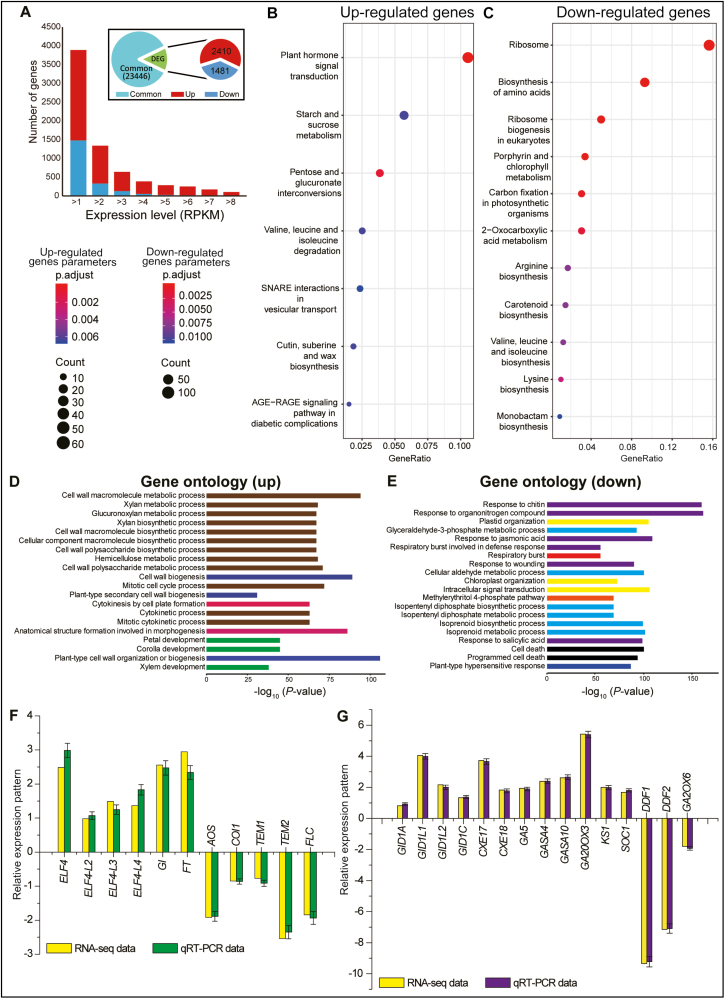
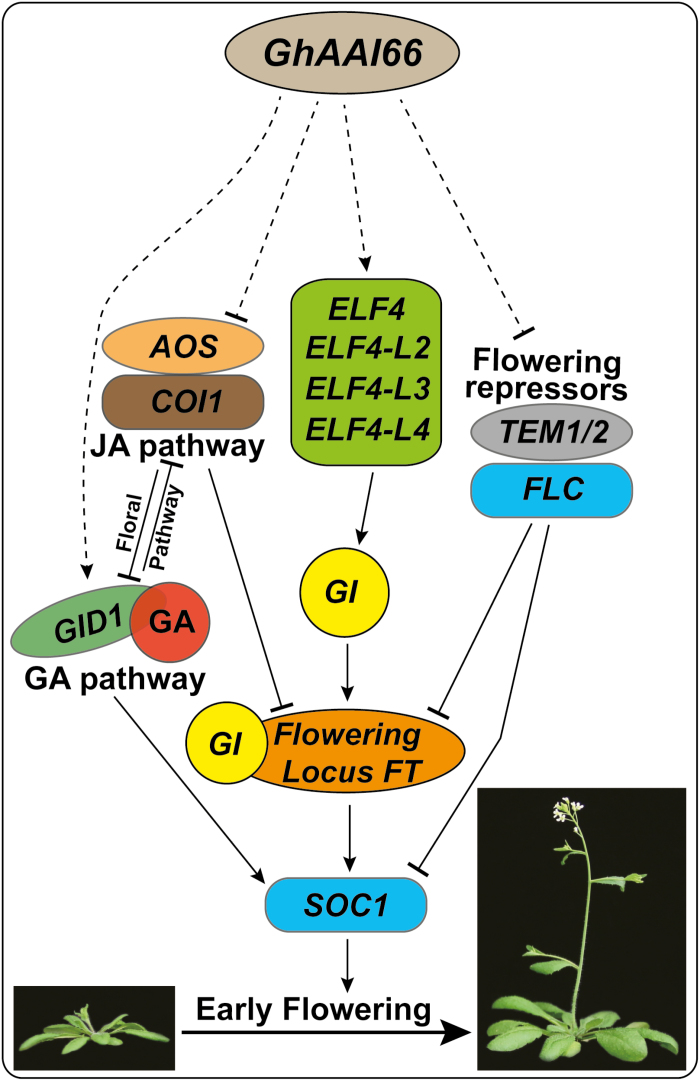
Plants undergo a phase transition from vegetative to reproductive development that triggers floral induction. Genes containing an AAI (α-amylase inhibitor) domain form a large gene family, but there have been no comprehensive analyses of this gene family in any plant species. Here, we identified 336 AAI genes from nine plant species including122 AAI genes in cotton (Gossypium hirsutum). The AAI gene family has evolutionarily conserved amino acid residues throughout the plant kingdom. Phylogenetic analysis classified AAI genes into five major clades with significant polyploidization and showing effects of genome duplication. Our study identified 42 paralogous and 216 orthologous gene pairs resulting from segmental and whole-genome duplication, respectively, demonstrating significant contributions of gene duplication to expansion of the cotton AAI gene family. Further, GhAAI66 was preferentially expressed in flower tissue and as responses to phytohormone treatments. Ectopic expression of GhAAI66 in Arabidopsis and silencing in cotton revealed that GhAAI66 triggers a phase transition to induce early flowering. Further, GO (Gene Ontology) and KEGG (Kyoto Encyclopedia of Genes and Genomes) analysis of RNA sequencing data and qRT-PCR (quantitative reverse transcription-PCR) analysis indicated that GhAAI66 integrates multiple flower signaling pathways including gibberellin, jasmonic acid, and floral integrators to trigger an early flowering cascade in Arabidopsis. Therefore, characterization of the AAI family provides invaluable insights for improving cotton breeding.

Keywords: Gossypium hirsutum; Early flowering; ectopic expression; floral integrators; gene duplication; phylogenetic analysis.


Figures

Fig. 1.
Fig. 1.
Phylogenetic analysis by the NJ method and number of AAI genes in nine plant species. The phylogenetic tree resolved all AAI genes from monocots, dicots, moss, and ferns into five major groups from AAI-a to AAI-e. The prefixes At, Ga, Gh, Gr, Tc, Os, Zm, Pp, and Sm were used before the names of A. thaliana, G. arboreum, G. hirsutum, G. raimondii, T. cacao, O. sativa, Z. mays, P. patens, and S. moellendorffii AAI genes, respectively. Bootstrap values are noted near nodes of each branch. (This figure is available in color at JXB online.)
Fig. 2.
Fig. 2.
Gene duplication and collinearity analysis among cotton AAI genes including G. hirsutum (At and Dt subgenome), G. arboreum (A-genome), and G. raimondii (D-genome). Lines connecting genes depict ortholog pairs diverged from the same ancestor. At-01 to At-13indicate At subgenome chromosomes, and Dt-01 to Dt-13 display Dt subgenome chromosomes. Similarly, A01 to A13 and D01 to D13 depict G. arboreum and G. raimondii chromosomes, respectively. (This figure is available in color at JXB online.)
Fig. 3.
Fig. 3.
Spatial expression pattern of GhAAI genes in different tissues using qRT–PCR analysis. Here, R, S, L, and F represent root, stem, leaf, and flower, respectively, while 1d, 3d, 5d, 7d, 10d, 15d, and 20d represent different days of ovule development. Further, 7, 10, 15, and 20 DPA indicate days of fiber development. Error bars indicate the SD of three independent biological repeats. (This figure is available in color at JXB online.)
Fig. 4.
Fig. 4.
Responses of GhAAI genes after treating with BL, GA, IAA, SA, and MeJA at different time points performed by qRT–PCR analysis. The error bars show the SD of three independent biological repeats. (This figure is available in color at JXB online.)
Fig. 5.
Fig. 5.
Ectopic expression of GhAAI66 differentially impacts the phase transition in Arabidopsis. (A) Phenotypes of three independent OE-GhAAI66 transgenic lines revealed phase transition to induce early flowering. Scale bars are 5 cm. (B) Days from germination to first flower opening. Data are means (±SD) (n=20). (C) Relative expression level of GhAAI66 in control and CLCrV:GhAAI66 plants. Student’s t-test: *P<0.05, **P<0.01, ***P<0.001. (D) Phenotype of control and CLCrV:GhAAI66 plants. (This figure is available in color at JXB online.)
Fig. 6.
Fig. 6.
Gene Ontology (GO) analysis of RNA-seq data of OE-GhAAI66 lines with respect to Col-0 Arabidopsis plants. (A) The expression map of the differentially expressed genes (DEGs). The bar graph shows the number of DEGs between Col-0 and OE-GhAAI66 plants. ‘Up’ and ‘down’ are the up-regulated and down-regulated genes in OE-GhAAI66 plants, respectively. (B) KEGG analysis of up-regulated genes from RNA-seq data. (C) KEGG analysis of down-regulated genes from RNA-seq data. Each experiment was conducted in three biological repeats. (D and E) Gene ontology enrichment of up- and down-regulated genes in OE-GhAAI66 plants. The lengths of the bars indicate the –log10-transformed P-values. (F, G) Relative expression pattern analysis of floral integrators, JA and GA receptors, biosynthesis, and catabolic genes by qRT–PCR analysis in order to validate RNA-seq data. (F) Up- and down-regulated floral integrators and JA receptor and biosynthesis genes. (G) Up- and down-regulated GA receptor and biosynthesis, responsive, and catabolic genes. Data are the log2fold change. Each experiment was conducted with three biological repeats. The error bars show the SD of three independent biological repeats. (This figure is available in color at JXB online.)
Fig. 7.
Fig. 7.
Proposed working model of GhAAI66 to induce the early flowering signaling cascade. (This figure is available in color at JXB online.)

References

    1. Altenhoff AM, Dessimoz C. 2009. Phylogenetic and functional assessment of orthologs inference projects and methods. PLoS Computational Biology 5, e1000262. - PMC - PubMed
    1. Anders S, Huber W. 2010. Differential expression analysis for sequence count data. Genome Biology 11, R106. - PMC - PubMed
    1. Angelovici R, Lipka AE, Deason N, Gonzalez-Jorge S, Lin H, Cepela J, Buell R, Gore MA, Dellapenna D. 2013. Genome-wide analysis of branched-chain amino acid levels in Arabidopsis seeds. The Plant Cell 25, 4827–4843. - PMC - PubMed
    1. Bailey TL, Williams N, Misleh C, Li WW. 2006. MEME: discovering and analyzing DNA and protein sequence motifs. Nucleic Acids Research 34, W369–W373. - PMC - PubMed
    1. Bao Y, Hu GJ, Flagel LE, Salmon A, Bezanilla M, Paterson AH, Wang ZN, Wendel JF. 2011. Parallel up-regulation of the profilin gene family following independent domestication of diploid and allopolyploid cotton (Gossypium). Proceedings of the National Academy of Sciences, USA 108, 21152–21157. - PMC - PubMed

Publication types