. 2019 Sep;40(13):3695-3711.
doi: 10.1002/hbm.24626. Epub 2019 May 20.

Evaluating arcuate fasciculus laterality measurements across dataset and tractography pipelines

Affiliations

Evaluating arcuate fasciculus laterality measurements across dataset and tractography pipelines

Jonathan S Bain et al. Hum Brain Mapp. 2019 Sep.

Abstract

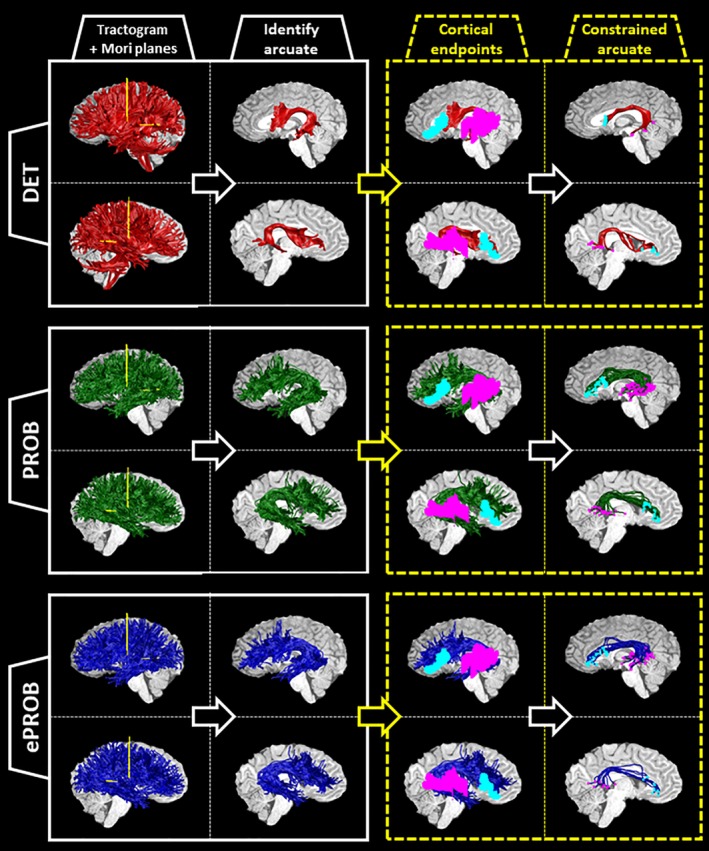
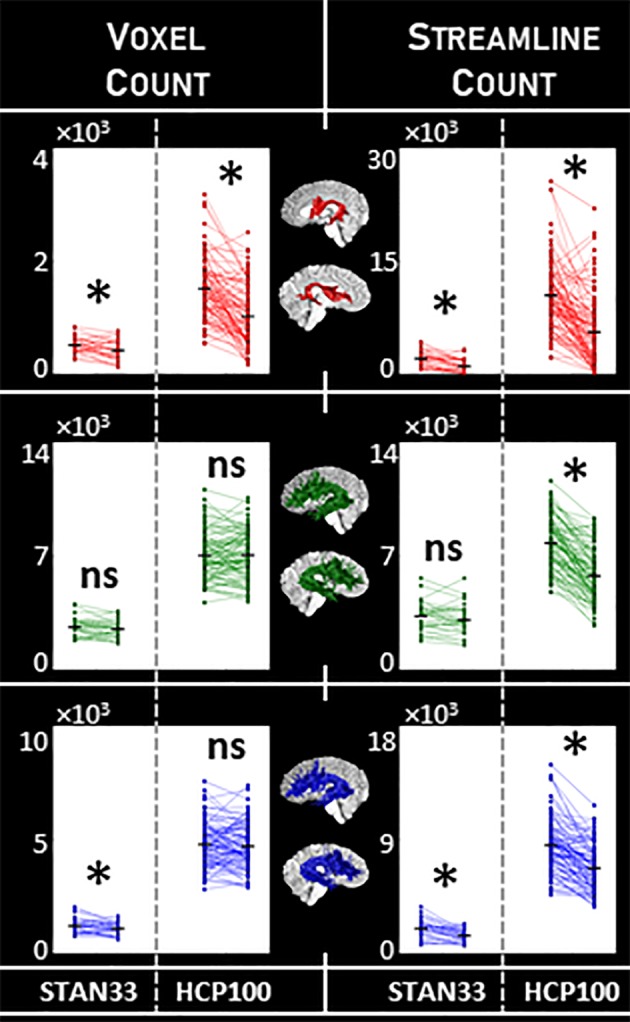
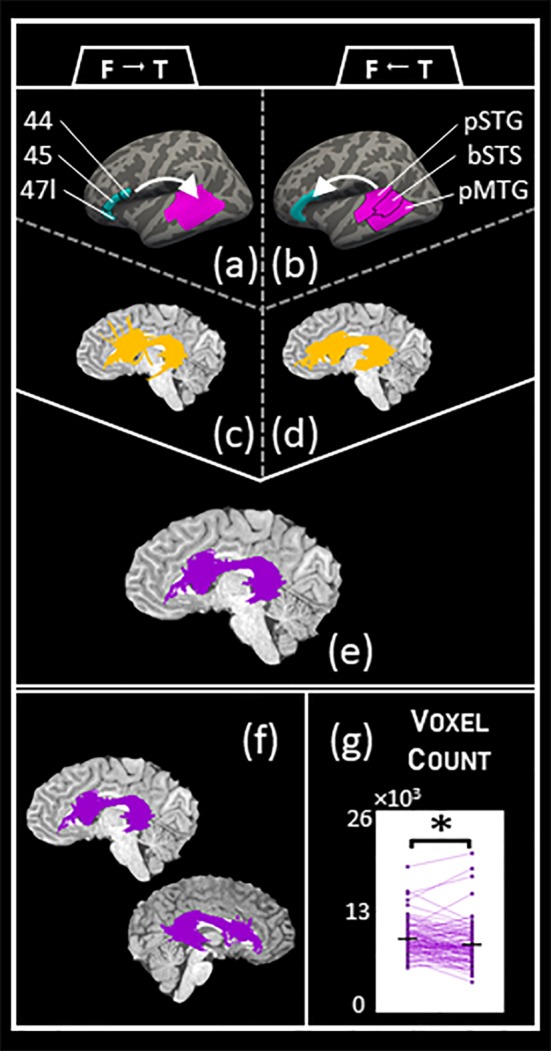
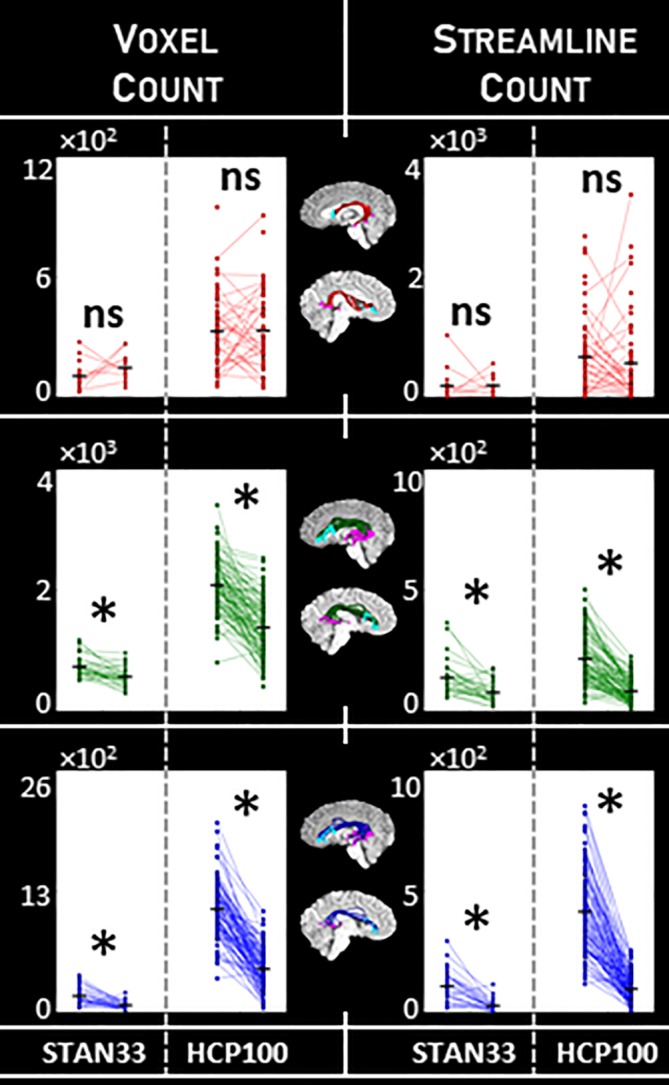
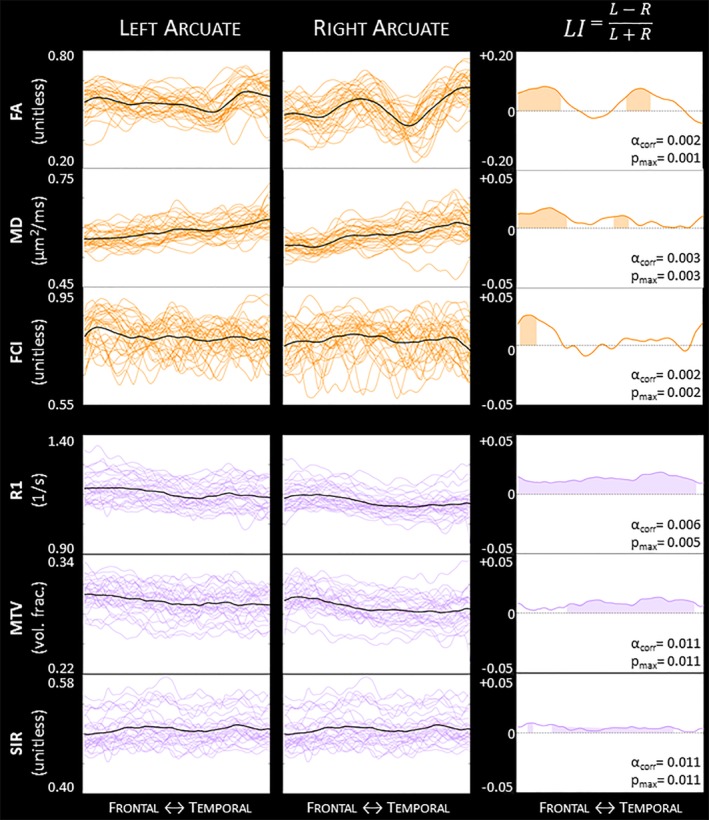
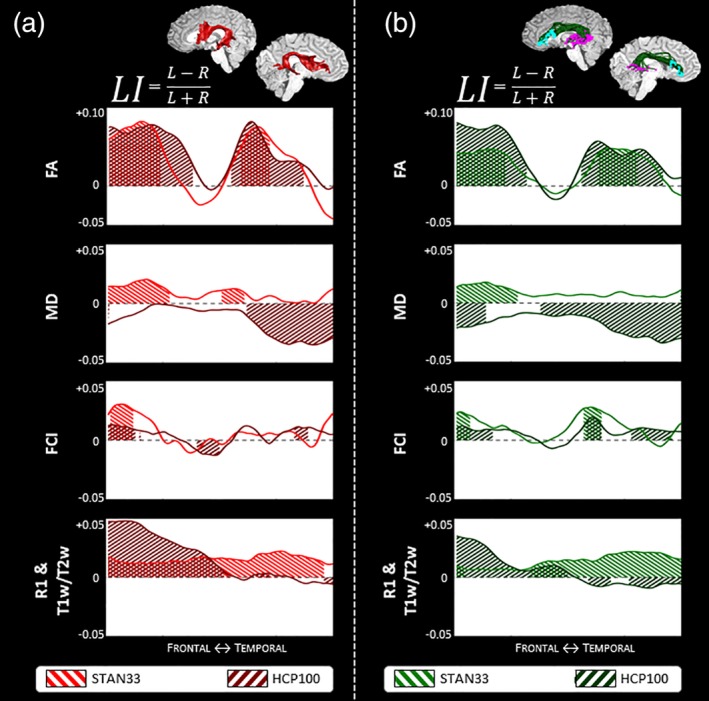
The arcuate fasciculi are white-matter pathways that connect frontal and temporal lobes in each hemisphere. The arcuate plays a key role in the language network and is believed to be left-lateralized, in line with left hemisphere dominance for language. Measuring the arcuate in vivo requires diffusion magnetic resonance imaging-based tractography, but asymmetry of the in vivo arcuate is not always reliably detected in previous studies. It is unknown how the choice of tractography algorithm, with each method's freedoms, constraints, and vulnerabilities to false-positive and -negative errors, impacts findings of arcuate asymmetry. Here, we identify the arcuate in two independent datasets using a number of tractography strategies and methodological constraints, and assess their impact on estimates of arcuate laterality. We test three tractography methods: a deterministic, a probabilistic, and a tractography-evaluation (LiFE) algorithm. We extract the arcuate from the whole-brain tractogram, and compare it to an arcuate bundle constrained even further by selecting only those streamlines that connect to anatomically relevant cortical regions. We test arcuate macrostructure laterality, and also evaluate microstructure profiles for properties such as fractional anisotropy and quantitative R1. We find that both tractography choice and implementing the cortical constraints substantially impact estimates of all indices of arcuate laterality. Together, these results emphasize the effect of the tractography pipeline on estimates of arcuate laterality in both macrostructure and microstructure.

Keywords: asymmetry; diffusion MRI; microstructure; quantitative MRI; tractogram.


Conflict of interest statement

The authors have no conflict of interest to declare.

Figures

Figure 1
Figure 1
Pipeline for identifying the arcuate fasciculus from three whole‐brain tractograms, illustrated on a sample subject. For each subject, a whole‐brain set of streamlines is generated three times: (1) with deterministic, tensor‐based tracking, labeled DET (red); (2) with a probabilistic, spherical‐deconvolution–based tracking, labeled PROB (green); and (3) with the application of a global evaluation algorithm to reduce the PROB tractogram, labeled ePROB (blue). After the tractogram is generated, two Mori waypoint planes (yellow) are inserted into each hemisphere (first column; see also Figure A11). The streamlines that intersect both planes in each hemisphere are labeled arcuate streamlines (second column). To incorporate additional anatomical information about the cortical destinations of the arcuate, we choose only those arcuate streamlines that connect to both the frontal and temporal cortical regions of interest (ROIs; cyan and magenta, respectively, in the third column). By implementing this constraint, we define a new, subset arcuate bundle (last column, with the endpoints marked in cyan and magenta). For each tractography, we show the left hemisphere on top and the right hemisphere on the bottom [Color figure can be viewed at http://wileyonlinelibrary.com]
Figure 2
Figure 2
Macrostructure laterality for the arcuate. We measured arcuate macrostructure using voxel count and streamline count (columns) for the three tractography classes DET, PROB, and ePROB (red, green, and blue, respectively). We tested for laterality using paired‐sample one‐tailed t tests; comparisons marked with * indicate p < α = .05, Bonferroni‐corrected, while nonsignificant comparisons are marked “ns.” We compare the two independent datasets STAN33 and HCP100, and identify the most consistency with DET. Measurements provided in Table 1. (Compare to Figure 4, and see also Figures A7 and A10) [Color figure can be viewed at http://wileyonlinelibrary.com]
Figure 3
Figure 3
Arcuate laterality with probtrackx2. (a,b) Schematic of probtrackx2 tracking. Each arcuate was tracked twice: once by seeding in the frontal region and tracking to the temporal region (a) and once by seeding in the temporal region and tracking to the frontal region (b). The frontal region is comprised of areas 44, 45, and 47l, while the temporal region is comprised of the posterior part of the superior temporal gyrus (pSTG), the banks of the superior temporal sulcus (bSTS), and the posterior part of the middle temporal gyrus (pMTG). We tracked 5,000 samples from each seed voxel. (c,d) The resulting arcuate voxels from the tracking described (a,b), respectively. The output of probtrackx2 is not a set of streamlines but rather the voxels that were visited in tracking from the seed to the target region, and we set a threshold on the voxels by selecting those that had been visited by at least the mean number of total samples. (e) Final arcuate voxels for probtrackx2 analysis, which is the overlap of (c) and (d). (f) Left and right probtrackx2 arcuate for the same sample subject as in Figure 1. (g) Testing for macrostructure laterality for the probtrackx2 arcuate. We identified the left and right arcuate in 95 of the 100 HCP100 subjects, and used a paired‐sample, one‐tailed t‐test to check for volume laterality. We found more voxels in the left arcuate (M = 9,480.2, SD = 2,157.5) than in the right arcuate (M = 8,744.9, SD = 2,704.1); t(94) = 3.88, p = 9.80 × 10⁻⁵. The significant leftward laterality effect in this probabilistic, region‐to‐region tracking is similar both to existing literature and to our findings with the cortically constrained arcuate (Table 2) [Color figure can be viewed at http://wileyonlinelibrary.com]
Figure 4
Figure 4
Macrostructure laterality for the arcuate with the cortical endpoints constraint. We measured arcuate macrostructure using voxel count and streamline count (columns) for the three tractography classes DET, PROB, and ePROB (red, green, and blue, respectively). We tested for laterality using paired‐sample one‐tailed t tests; comparisons marked with * indicate p < α = .05, Bonferroni‐corrected, while nonsignificant comparisons are marked “ns.” We compare the two independent datasets STAN33 and HCP100, and find PROB and EPOB show a consistent laterality effect while DET no longer does. Measurements provided in Table 2 [Color figure can be viewed at http://wileyonlinelibrary.com]
Figure 5
Figure 5
DET arcuate individual tract profiles and LI profiles for the STAN33 dataset. We illustrate microstructure laterality for the diffusion measurements FA, MD, and FCI (orange) and the quantitative nondiffusion measurements R1, MTV, and SIR (purple). Individual tract profiles for subjects' left and right arcuate are displayed in the thin colored lines, while the group mean is displayed with a thick black line. The right column shows the group LI profiles, whereby a positive LI score indicates a leftward asymmetry and a negative LI score indicates a rightward laterality. (Note the different y axis for the first LI profile.) The shaded areas denote segments along the profile that display statistically significant asymmetry, as calculated with a permutation test; α corr is the new alpha value after correcting initial α = .05; and p max is the largest p‐value within the shaded area. See also Figures A20–A24. FA = fractional anisotropy; FCI = Fiber Coherence Index; MD = mean diffusivity; MTV = macromolecular tissue volume; SIR = surface interaction rate [Color figure can be viewed at http://wileyonlinelibrary.com]
Figure 6
Figure 6
Comparing arcuate microstructure laterality profiles between datasets. We compare the STAN33 and HCP100 datasets using both the DET arcuate (a) and the PROB constrained arcuate (b). We illustrate microstructure laterality for the diffusion measurements FA, MD, and FCI and the nondiffusion measurements quantitative R1 (STAN33 data only) or semiquantitative T1w/T2w (HCP100 data only). A positive LI score indicates a leftward asymmetry and a negative LI score indicates a rightward laterality, with shaded areas denoting segments along the profile that display statistically significant asymmetry, as calculated with a permutation test. See also Figures A26–A28. FA = fractional anisotropy; MTV = macromolecular tissue volume [Color figure can be viewed at http://wileyonlinelibrary.com]

References

    1. Allendorfer, J. B. , Hernando, K. A. , Hossain, S. , Nenert, R. , Holland, S. K. , & Szaflarski, J. P. (2016). Arcuate fasciculus asymmetry has a hand in language function but not handedness. Human Brain Mapping, 37(9), 3297–3309. 10.1002/hbm.23241 - DOI - PMC - PubMed
    1. Amunts, K. , Schleicher, A. , Burgel, U. , Mohlberg, H. , Uylings, H. B. , & Zilles, K. (1999). Broca's region revisited: Cytoarchitecture and intersubject variability. The Journal of Comparative Neurology, 412(2), 319–341. - PubMed
    1. Amunts, K. , Schleicher, A. , Ditterich, A. , & Zilles, K. (2003). Broca's region: Cytoarchitectonic asymmetry and developmental changes. The Journal of Comparative Neurology, 465(1), 72–89. 10.1002/cne.10829 - DOI - PubMed
    1. Avants, B. B. , Tustison, N. J. , Song, G. , Cook, P. A. , Klein, A. , & Gee, J. C. (2011). A reproducible evaluation of ANTs similarity metric performance in brain image registration. NeuroImage, 54(3), 2033–2044. 10.1016/j.neuroimage.2010.09.025 - DOI - PMC - PubMed
    1. Baddeley, A. (2007). Working memory, thought, and action (1st ed.). New York, NY: Oxford University Press.

Publication types