

A Link Between Plasma Microbial Translocation, Microbiome, and Autoantibody Development in First-Degree Relatives of Systemic Lupus Erythematosus Patients
- PMID: 31106972
- PMCID: PMC6817371
- DOI: 10.1002/art.40935
A Link Between Plasma Microbial Translocation, Microbiome, and Autoantibody Development in First-Degree Relatives of Systemic Lupus Erythematosus Patients
Abstract
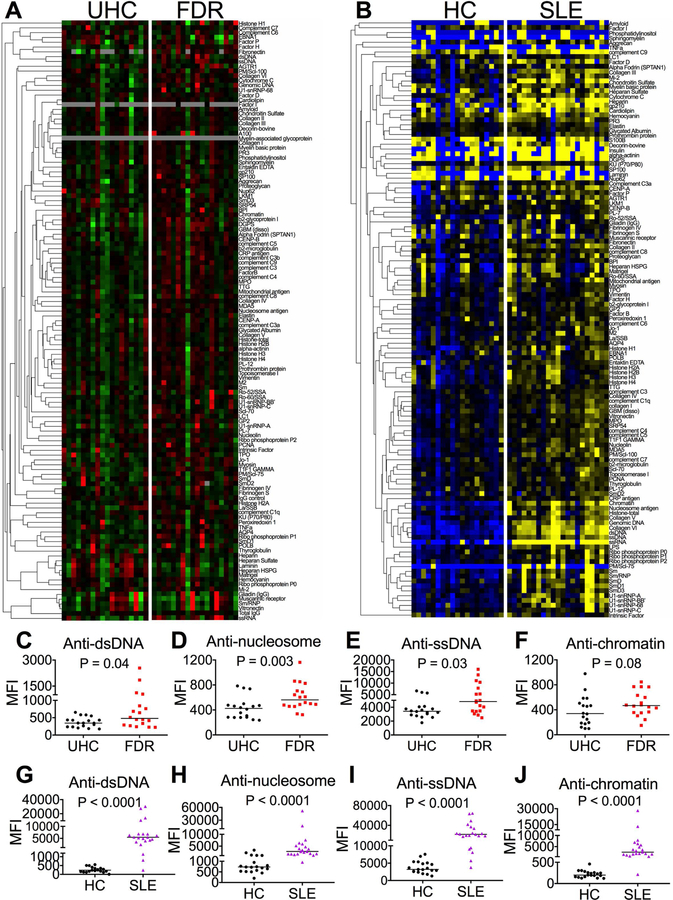
Objective: Systemic lupus erythematosus (SLE) is characterized by the production of antibodies against self antigens. However, the events underlying autoantibody formation in SLE remain unclear. This study was undertaken to investigate the role of plasma autoantibody levels, microbial translocation, and the microbiome in SLE.
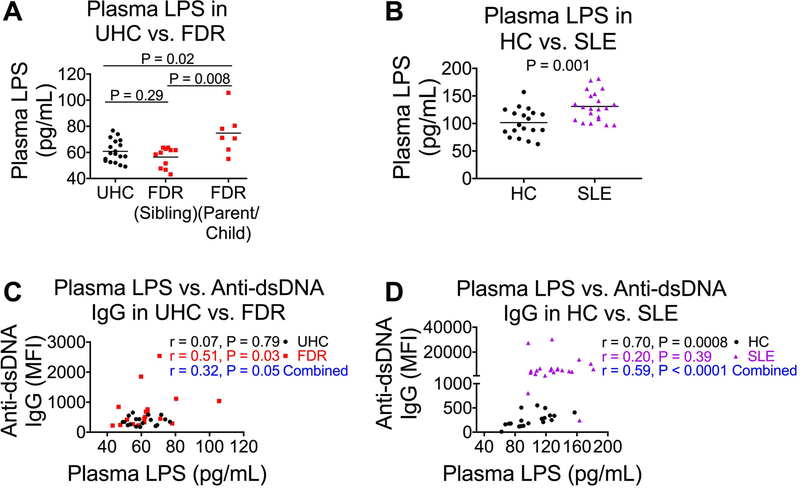
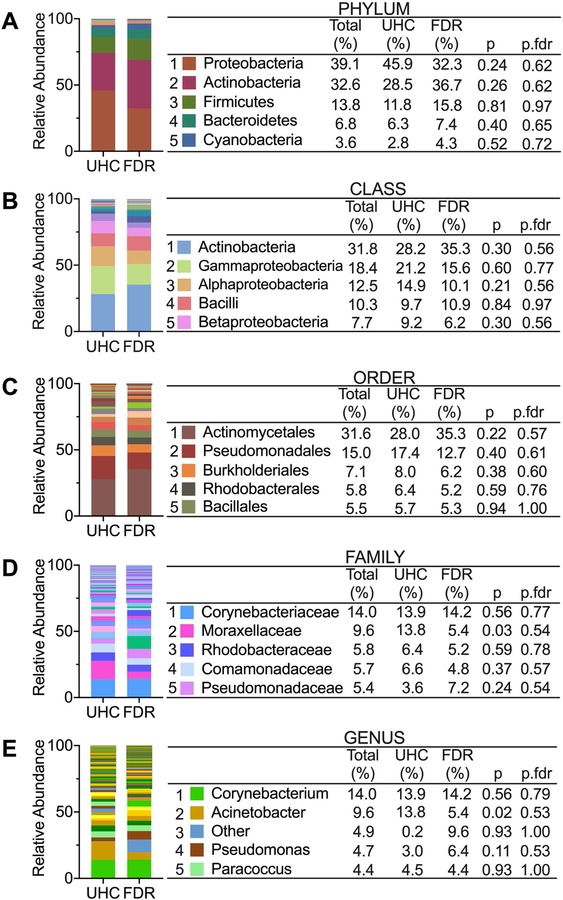
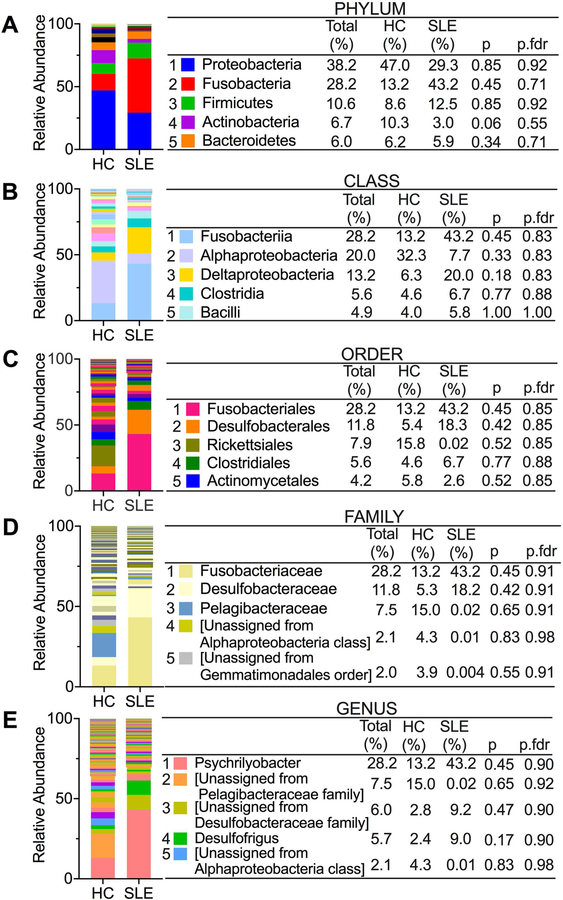
Methods: Plasma samples from 2 cohorts, one with 18 unrelated healthy controls and 18 first-degree relatives and the other with 19 healthy controls and 21 SLE patients, were assessed for autoantibody levels by autoantigen microarray analysis, measurement of lipopolysaccharide (LPS) levels by Limulus amebocyte assay, and determination of microbiome composition by microbial 16S ribosomal DNA sequencing.
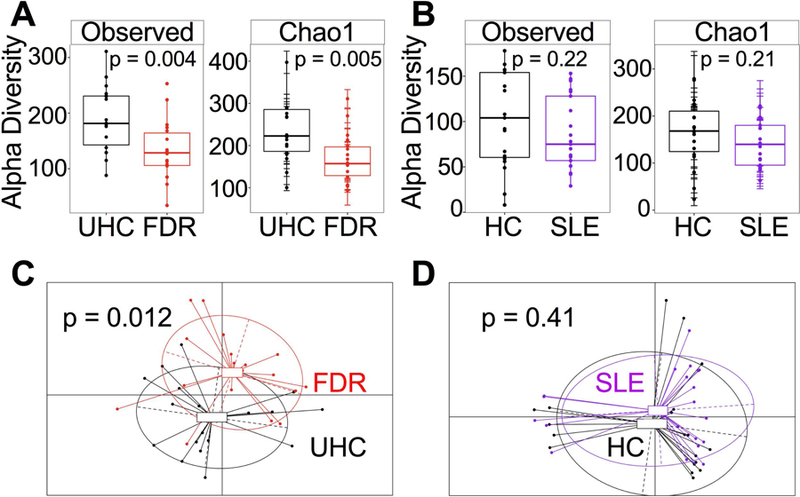
Results: First-degree relatives and SLE patients exhibited increased plasma autoantibody levels compared to their control groups. Parents and children of lupus patients exhibited elevated plasma LPS levels compared to controls (P = 0.02). Plasma LPS levels positively correlated with plasma anti-double-stranded DNA IgG levels in first-degree relatives (r = 0.51, P = 0.03), but not in SLE patients. Circulating microbiome analysis revealed that first-degree relatives had significantly reduced microbiome diversity compared to their controls (observed species, P = 0.004; Chao1 index, P = 0.005), but this reduction was not observed in SLE patients. The majority of bacteria that were differentially abundant between unrelated healthy controls and first-degree relatives were in the Firmicutes phylum, while differences in bacteria from several phyla were identified between healthy controls and SLE patients. Bacteria in the Paenibacillus genus were the only overlapping differentially abundant bacteria in both cohorts, and were reduced in first-degree relatives (adjusted P [Padj ] = 2.13 × 10⁻¹² ) and SLE patients (Padj = 0.008) but elevated in controls.
Conclusions: These results indicate a possible role of plasma microbial translocation and microbiome composition in influencing autoantibody development in SLE.
© 2019, American College of Rheumatology.
Conflict of interest statement
Figures
Comment in
-
Alternative Explanations for the Divergence in Plasma Microbial Translocation and Microbiome Composition Results Between Patients With Systemic Lupus Erythematosus and First-Degree Relatives: Comment on the Article by Ogunrinde et al.Arthritis Rheumatol. 2019 Dec;71(12):2126-2127. doi: 10.1002/art.41046. Epub 2019 Oct 23. Arthritis Rheumatol. 2019. PMID: 31313520 No abstract available.
-
Reply.Arthritis Rheumatol. 2019 Dec;71(12):2127. doi: 10.1002/art.41044. Epub 2019 Oct 21. Arthritis Rheumatol. 2019. PMID: 31314177 No abstract available.
References
-
- Tsokos GC, Lo MS, Costa Reis P, and Sullivan KE, New insights into the immunopathogenesis of systemic lupus erythematosus. Nature reviews. Rheumatology, 2016. 12(12): p. 716–730. - PubMed
-
- Alarcón-Segovia D, Alarcón-Riquelme ME, Cardiel MH, Caeiro F, Massardo L, Villa AR, et al., Familial aggregation of systemic lupus erythematosus, rheumatoid arthritis, and other autoimmune diseases in 1,177 lupus patients from the GLADEL cohort. Arthritis & Rheumatism, 2005. 52(4): p. 1138–1147. - PubMed
-
- Navarra SV, Ishimori ML, Uy EA, Hamijoyo L, Sama J, James JA, et al., Studies of Filipino patients with systemic lupus erythematosus: Autoantibody profile of first-degree relatives. Lupus, 2011. 20(5): p. 537–543. - PubMed
Publication types
MeSH terms
Substances
Grants and funding
- R21 AR067459/AR/NIAMS NIH HHS/United States
- U54 CA210962/CA/NCI NIH HHS/United States
- R01 AI128864/AI/NIAID NIH HHS/United States
- U54 CA210963/CA/NCI NIH HHS/United States
- P30 CA138313/CA/NCI NIH HHS/United States
- P30 AR072582/AR/NIAMS NIH HHS/United States
- R21 TR002513/TR/NCATS NIH HHS/United States
- R01 LM012517/LM/NLM NIH HHS/United States
- I01 CX001211/CX/CSRD VA/United States
- UL1 RR029882/RR/NCRR NIH HHS/United States
- Biorepository & Tissue Analysis Shared Resource/International
- M01 RR001070/RR/NCRR NIH HHS/United States
- P50 AR070591/AR/NIAMS NIH HHS/United States
- UL1 TR001450/TR/NCATS NIH HHS/United States
- K24 AR068406/AR/NIAMS NIH HHS/United States
- CX-001211/Medical Research Service at the Ralph H. Johnson VA Medical Center/International
- Brazilian Institution CNPq/International
- T32 AR050958/AR/NIAMS NIH HHS/United States
- R01 CA164964/CA/NCI NIH HHS/United States
- P60 AR062755/AR/NIAMS NIH HHS/United States
LinkOut - more resources
Full Text Sources
Medical
