Case Reports
. 2019 Jul;7(7):e00698.
doi: 10.1002/mgg3.698. Epub 2019 May 20.

Identification of novel compound heterozygous mutations in ACO2 in a patient with progressive cerebral and cerebellar atrophy

Affiliations
Case Reports

Identification of novel compound heterozygous mutations in ACO2 in a patient with progressive cerebral and cerebellar atrophy

Masahide Fukada et al. Mol Genet Genomic Med. 2019 Jul.

Abstract

Background: The tricarboxylic acid (TCA) cycle is a sequence of catabolic reactions within the mitochondrial matrix, and is a central pathway for cellular energy metabolism. Genetic defects affecting the TCA cycle are known to cause severe multisystem disorders.

Methods: We performed whole exome sequencing of genomic DNA of a patient with progressive cerebellar and cerebral atrophy, hypotonia, ataxia, seizure disorder, developmental delay, ophthalmological abnormalities and hearing loss. We also performed biochemical studies using patient fibroblasts.

Results: We identified new compound heterozygous mutations (c.1534G > A, p.Asp512Asn and c.1997G > C, p.Gly666Ala) in ACO2, which encodes aconitase 2, a component of the TCA cycle. In patient fibroblasts, the aconitase activity was reduced to 15% of that of the control, and the aconitase 2 level decreased to 36% of that of the control. As such a decrease in aconitase 2 in patient fibroblasts was partially restored by proteasome inhibition, mutant aconitase 2 was suggested to be relatively unstable and rapidly degraded after being synthesized. In addition, the activity of the father-derived variant of aconitase 2 (p.Gly666Ala), which had a mutation near the active center, was 55% of that of wild-type.

Conclusion: The marked reduction of aconitase activity in patient fibroblasts was due to the combination of decreased aconitase 2 amount and activity due to mutations. Reduced aconitase activity directly suppresses the TCA cycle, resulting in mitochondrial dysfunction, which may lead to symptoms similar to those observed in mitochondrial diseases.

Keywords: ACO2; TCA cycle; aconitase; ataxia; brain atrophy; hypotonia; mitochondria.


Conflict of interest statement

None.

Figures
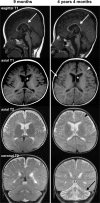
Figure 1
Figure 1
Brain magnetic resonance imaging examinations of the patient at 9 months and 4 years 4 months revealed progressive cerebral and cerebellar atrophy, and white matter abnormalities. T1‐weighted (sagittal and axial) and T2‐weighted (axial and coronal) images are shown. Malformation of the corpus callosum (sagittal T1, arrows), lateral ventricular enlargement (axial T1, asterisks), white matter abnormalities (axial T1 and 2, arrowheads), and cerebral (axial T1, arrow) and cerebellar (coronal T2, arrow) atrophy are marked in the figure
Figure 2
Figure 2
The aconitase activity and amount of aconitase 2 protein were both reduced in patient fibroblasts. (a) The aconitase activity in control and patient fibroblasts. Fibroblasts were lysed and cell extracts were assayed for aconitase activity. Data (expressed as nmol per minute per mg protein of cell extract) represent mean values ± SD from three independent experiments with triplicate measurements in each. The aconitase activity in patient fibroblasts was reduced to approximately 15% of that in control fibroblasts. (b) Western blot analysis of cell extracts from control and patient fibroblasts with antibodies against aconitase 2 (ACO2), aconitase 1 (ACO1), E1α subunit of pyruvate dehydrogenase (PDH E1α) and α‐tubulin. The signal of the patient ACO2 band was much weaker than those of the controls. The right graph shows the densitometric quantification of Western blot results. Data shown are the levels of aconitase 1 and aconitase 2 (normalized by α‐tubulin) in patient fibroblasts relative to those in controls, and are mean values ± SD from three independent experiments. ***p < 0.001 by the unpaired, two‐tailed Student's t test
Figure 3
Figure 3
The reduced amount of aconitase 2 in patient fibroblasts was partially recovered by inhibiting proteasome activity. (a) Confocal immunofluorescence images showing subcellular localization of aconitase 2 (ACO2; red), E1α subunit of pyruvate dehydrogenase (PDH E1α; green) and nuclei (DAPI; blue) in control and patient fibroblasts treated for 0 or 8 hr with the proteasome inhibitor MG132 (20 μg/ml). PDH E1α was used as a mitochondrial marker. The aconitase 2 signals in the patient cells were very weak compared to those in the control (see −MG132 panels), but were clearly enhanced after MG132 treatment (see +MG132 panels). (b) Western blot analysis of aconitase 2 expression in fibroblasts treated with MG132 (20 μg/ml) for 0, 4 or 8 hr. The upper panel shows a representative Western blot, and the lower graph shows the densitometric quantification of Western blot results. Data represent aconitase 2 levels (normalized by α‐tubulin) relative to the control (0 hr), and are mean values ± SD from three independent experiments. **p < 0.01, ***p < 0.001 for 0 hr versus 4 or 8 hr (Patient) by the unpaired, two‐tailed Student's t test
Figure 4
Figure 4
Comparison of aconitase activity of the wild‐type aconitase 2 and three mutants.(a) myc‐tagged aconitase 2, wild‐type (WT), and p.Asp512Asn, p.Gly666Ala and p.Gly259Asp mutants were each expressed in HEK293 cells, and cell extracts were assayed for aconitase activity. Values ± SD are shown as the percentage of WT in three independent experiments, each having triplicate assays. **p < 0.01, ***p < 0.001 for WT versus mutant aconitase 2, by the unpaired, two‐tailed Student's t test. (b) Western blot analysis of the cell extracts used in “A” with anti‐myc, ACO2 and α‐tubulin antibodies. The amounts of myc‐tagged aconitase 2 proteins (myc‐ACO2) used in the assay were all comparable

Similar articles

Cited by

References

    1. Abela, L. , Spiegel, R. , Crowther, L. M. , Klein, A. , Steindl, K. , Papuc, S. M. , … Simmons, T. L. (2017). Plasma metabolomics reveals a diagnostic metabolic fingerprint for mitochondrial aconitase (ACO2) deficiency. PLoS ONE, 12(5), E0176363 10.1371/journal.pone.0176363 - DOI - PMC - PubMed
    1. Adzhubei, I. A. , Schmidt, S. , Peshkin, L. , Ramensky, V. E. , Gerasimova, A. , Bork, P. , … Sunyaev, S. R. (2010). A method and server for predicting damaging missense mutations. Nature Methods, 7(4), 248–249. 10.1038/nmeth0410-248 - DOI - PMC - PubMed
    1. Bourgeron, T. , Chretien, D. , Poggi-Bach, J. , Doonan, S. , Rabier, D. , Letouzé, P. , … Rustin, P. (1994). Mutation of the fumarase gene in two siblings with progressive encephalopathy and fumarase deficiency. Journal of Clinical Investigation, 93(6), 2514–2518. 10.1172/JCI117261. - DOI - PMC - PubMed
    1. Bourgeron, T. , Rustin, P. , Chretien, D. , Birch‐Machin, M. , Bourgeois, M. , Viegas‐Péquignot, E. , … Rötig, A. (1995). Mutation of a nuclear succinate dehydrogenase gene results in mitochondrial respiratory chain deficiency. Nature Genetics, 11(2), 144–149. 10.1038/ng1095-144 - DOI - PubMed
    1. Elpeleg, O. , Miller, C. , Hershkovitz, E. , Bitner‐Glindzicz, M. , Bondi‐Rubinstein, G. , Rahman, S. , … Saada, A. (2005). Deficiency of the ADP‐forming succinyl‐CoA synthase activity is associated with encephalomyopathy and mitochondrial DNA depletion. The American Journal of Human Genetics, 76(6), 1081–1086. 10.1086/430843 - DOI - PMC - PubMed

Publication types