Review
. 2019 Jun;25(6):1041-1049.
doi: 10.3201/eid2506.180138.

Using Big Data to Monitor the Introduction and Spread of Chikungunya, Europe, 2017

Review

Using Big Data to Monitor the Introduction and Spread of Chikungunya, Europe, 2017

Joacim Rocklöv et al. Emerg Infect Dis. 2019 Jun.

Abstract

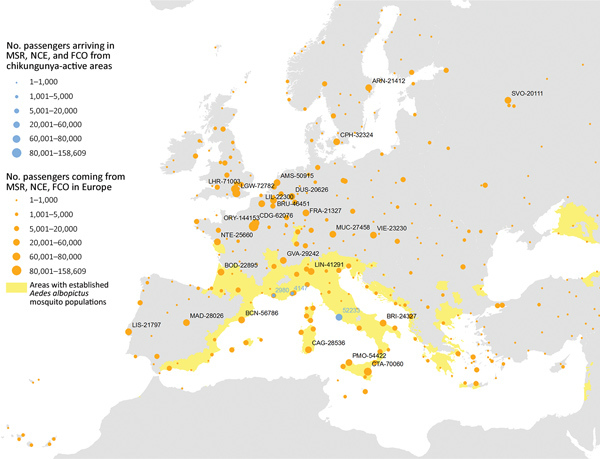
With regard to fully harvesting the potential of big data, public health lags behind other fields. To determine this potential, we applied big data (air passenger volume from international areas with active chikungunya transmission, Twitter data, and vectorial capacity estimates of Aedes albopictus mosquitoes) to the 2017 chikungunya outbreaks in Europe to assess the risks for virus transmission, virus importation, and short-range dispersion from the outbreak foci. We found that indicators based on voluminous and velocious data can help identify virus dispersion from outbreak foci and that vector abundance and vectorial capacity estimates can provide information on local climate suitability for mosquitoborne outbreaks. In contrast, more established indicators based on Wikipedia and Google Trends search strings were less timely. We found that a combination of novel and disparate datasets can be used in real time to prevent and control emerging and reemerging infectious diseases.

Keywords: Aedes albopictus; Europe; arbovirus; big data; chikungunya; data science; human mobility; social media; vector-borne infections; vectorial capacity; viruses.


Figures

Figure 1
Figure 1
Vectorial capacity estimates based on average temperature conditions in Europe with stable populations of Aedes albopictus mosquitoes around chikungunya outbreak zones, Italy and France, July–October 2017. Heavy outlines indicate the outbreak areas. The vectorial capacity translates to an average basic reproduction number in the range of 2–3 in Anzio and Rome and in the range of 3–4 in Calabria during the months of July and August for an infectious period of 4 days.
Figure 2
Figure 2
Notified chikungunya cases in the Anzio (A), Rome (B), and Calabria (C) regions and basic reproduction number (R0) estimates of outbreaks, June–October 2017, Italy.
Figure 3
Figure 3
Incoming passengers from chikungunya active transmission areas and outgoing passengers to other airports in Europe from Rome (FCO), Marseille (MRS), and Nice (NCE) airports, August 2017. The stable vector presence area is highlighted in yellow.
Figure 4
Figure 4
MP estimates from the Lazio region, Italy, to areas in Europe with stable populations of Aedes albopictus mosquitoes, July–September 2017. Heavy outlines indicate the chikungunya outbreak areas. MP, mobility proximity.
Figure 5
Figure 5
Estimated areas of risk for chikungunya spread from the outbreak areas of Anzio and Rome in the Lazio region, Italy, based on combined VC and estimates, August–October 2017. Heavy outlines indicate the outbreak areas. MP, mobility proximity; VC, vectorial capacity.
Figure 6
Figure 6
Estimated areas of risk for chikungunya spread from the outbreak areas in Lazio region, Italy, based on MP estimates, August–September 2017. A) Anzio; B) Rome. Circles indicate number of reported cases. MP, mobility proximity.

Similar articles

Cited by

References

    1. Simonsen L, Gog JR, Olson D, Viboud C. Infectious disease surveillance in the big data era: towards faster and locally relevant systems. J Infect Dis. 2016;214(suppl_4):S380–5. 10.1093/infdis/jiw376 - DOI - PMC - PubMed
    1. Butler D. When Google got flu wrong. Nature. 2013;494:155–6. 10.1038/494155a - DOI - PubMed
    1. Ginsberg J, Mohebbi MH, Patel RS, Brammer L, Smolinski MS, Brilliant L. Detecting influenza epidemics using search engine query data. Nature. 2009;457:1012–4. 10.1038/nature07634 - DOI - PubMed
    1. McIver DJ, Brownstein JS. Wikipedia usage estimates prevalence of influenza-like illness in the United States in near real-time. PLOS Comput Biol. 2014;10:e1003581. 10.1371/journal.pcbi.1003581 - DOI - PMC - PubMed
    1. Health HSoP. HealthMap. 2016. [cited 2017 Jan 5]. http://www.healthmap.org

MeSH terms