

Joint Estimation of Relative Risk for Dengue and Zika Infections, Colombia, 2015-2016
- PMID: 31107226
- PMCID: PMC6537708
- DOI: 10.3201/eid2506.180392
Joint Estimation of Relative Risk for Dengue and Zika Infections, Colombia, 2015-2016
Abstract
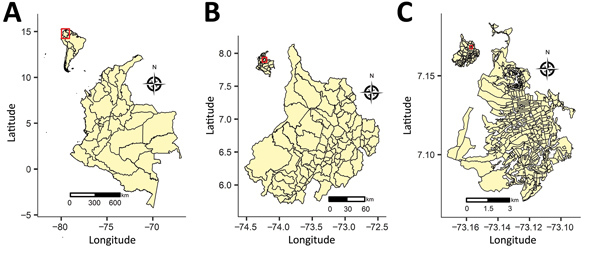
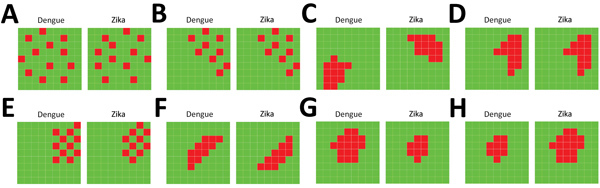
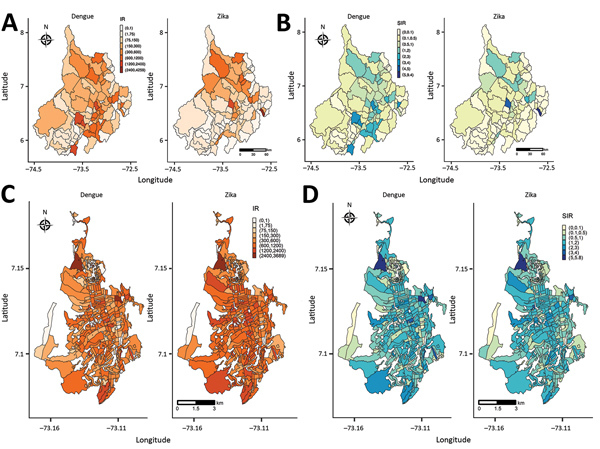
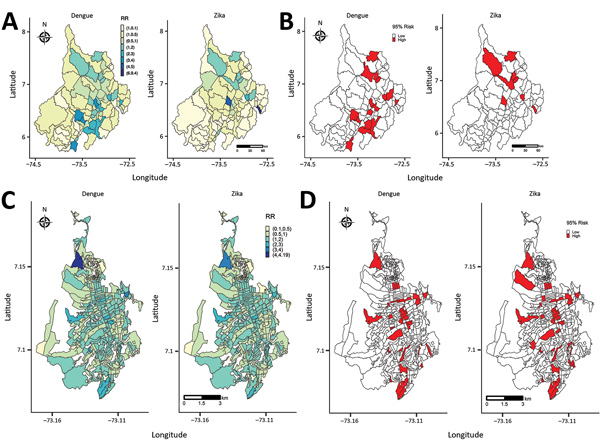
We jointly estimated relative risk for dengue and Zika virus disease (Zika) in Colombia, establishing the spatial association between them at the department and city levels for October 2015-December 2016. Cases of dengue and Zika were allocated to the 87 municipalities of 1 department and the 293 census sections of 1 city in Colombia. We fitted 8 hierarchical Bayesian Poisson joint models of relative risk for dengue and Zika, including area- and disease-specific random effects accounting for several spatial patterns of disease risk (clustered or uncorrelated heterogeneity) within and between both diseases. Most of the dengue and Zika high-risk municipalities varied in their risk distribution; those for Zika were in the northern part of the department and dengue in the southern to northeastern parts. At city level, spatially clustered patterns of dengue high-risk census sections indicated Zika high-risk areas. This information can be used to inform public health decision making.
Keywords: Bayesian models; Colombia; Risk maps; Zika virus; conditional auto-regressive prior; dengue virus; multivariate risk models; viruses.
Figures
References
-
- National Health Institute. Event report: dengue, 2016. [in Spanish] [cited 2019 Apr 1]. http://www.ins.gov.co/buscador-http://www.ins.gov.co/buscador-eventos/In...
-
- National Health Institute of Colombia. Weekly epidemiological bulletin number 52 of 2016, 25 December–31 December [in Spanish] [cited 2019 Apr 1]. http://www.ins.gov.co/buscador-eventos/BoletinEpidemiologico/2016%20Bole...
-
- Banerjee S, Carlin BP, Gelfand AE. Hierarchical modeling and analysis for spatial data. In: Bunea F, Isham V, Keiding N, Louis T, Smith RL, Tong H, editors. Chapman & Hall/CRC Monographs on Statistics & Applied Probability. 2nd ed. Boca Raton (FL): Taylor & Francis Group; 2014. p. 305–24.
Publication types
MeSH terms
LinkOut - more resources
Full Text Sources
Medical
