Association of Intraoperative Ventilator Management With Postoperative Oxygenation, Pulmonary Complications, and Mortality
- PMID: 31107262
- PMCID: PMC8592391
- DOI: 10.1213/ANE.0000000000004191
Association of Intraoperative Ventilator Management With Postoperative Oxygenation, Pulmonary Complications, and Mortality
Abstract
Background: "Lung-protective ventilation" describes a ventilation strategy involving low tidal volumes (VTs) and/or low driving pressure/plateau pressure and has been associated with improved outcomes after mechanical ventilation. We evaluated the association between intraoperative ventilation parameters (including positive end-expiratory pressure [PEEP], driving pressure, and VT) and 3 postoperative outcomes: (1) PaO2/fractional inspired oxygen tension (FIO2), (2) postoperative pulmonary complications, and (3) 30-day mortality.
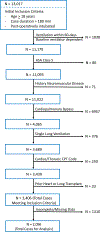
Methods: We retrospectively analyzed adult patients who underwent major noncardiac surgery and remained intubated postoperatively from 2006 to 2015 at a single US center. Using multivariable regressions, we studied associations between intraoperative ventilator settings and lowest postoperative PaO2/FIO2 while intubated, pulmonary complications identified from discharge diagnoses, and in-hospital 30-day mortality.
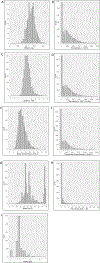
Results: Among a cohort of 2096 cases, the median PEEP was 5 cm H2O (interquartile range = 4-6), median delivered VT was 520 mL (interquartile range = 460-580), and median driving pressure was 15 cm H2O (13-19). After multivariable adjustment, intraoperative median PEEP (linear regression estimate [B] = -6.04; 95% CI, -8.22 to -3.87; P < .001), median FIO2 (B = -0.30; 95% CI, -0.50 to -0.10; P = .003), and hours with driving pressure >16 cm H2O (B = -5.40; 95% CI, -7.2 to -4.2; P < .001) were associated with decreased postoperative PaO2/FIO2. Higher postoperative PaO2/FIO2 ratios were associated with a decreased risk of pulmonary complications (adjusted odds ratio for each 100 mm Hg = 0.495; 95% CI, 0.331-0.740; P = .001, model C-statistic of 0.852) and mortality (adjusted odds ratio = 0.495; 95% CI, 0.366-0.606; P < .001, model C-statistic of 0.820). Intraoperative time with VT >500 mL was also associated with an increased likelihood of developing a postoperative pulmonary complication (adjusted odds ratio = 1.06/hour; 95% CI, 1.00-1.20; P = .042).
Conclusions: In patients requiring postoperative intubation after noncardiac surgery, increased median FIO2, increased median PEEP, and increased time duration with elevated driving pressure predict lower postoperative PaO2/FIO2. Intraoperative duration of VT >500 mL was independently associated with increased postoperative pulmonary complications. Lower postoperative PaO2/FIO2 ratios were independently associated with pulmonary complications and mortality. Our findings suggest that postoperative PaO2/FIO2 may be a potential target for future prospective trials investigating the impact of specific ventilation strategies for reducing ventilator-induced pulmonary injury.
Conflict of interest statement
Figures


References
-
- Sloane PJ, Gee MH, Gottlieb JE, Albertine KH, Peters SP, Burns JR, Machiedo G, Fish JE. A multicenter registry of patients with acute respiratory distress syndrome: physiology and outcome. Am. Rev. Respir. Dis. 1992;146(2):419–26. - PubMed
-
- Zilberberg MD, Epstein SK. Acute lung injury in the medical ICU: comorbid conditions, age, etiology, and hospital outcome. Am. J. Respir. Crit. Care Med. 1998;157(4):1159–64. - PubMed
-
- Amato MBP, Barbas CSV, Medeiros DM, Magaldi RB, Schettino GP, Lorenzi-Filho G, Kairalla RA, Deheinzelin D, Munoz C, Olveira R, Takagaki TY, Carvalho CRR. Effect of a protective-ventilation strategy on mortality in the acute respiratory distress syndrome. N. Engl. J. Med. 1998;338(6):347–54. - PubMed
-
- The Acute Respiratory Distress Syndrome Network: Ventilation with lower tidal volumes as compared with traditional tidal volumes for acute lung injury and the acute respiratory distress syndrome. N. Engl. J. Med. 2000;342:1301–8. - PubMed
MeSH terms
Substances
Grants and funding
LinkOut - more resources
Full Text Sources
Medical

