. 2019 Aug;33(8):9388-9403.
doi: 10.1096/fj.201900032R. Epub 2019 May 20.

Coalescing replication compartments provide the opportunity for recombination between coinfecting herpesviruses

Affiliations

Coalescing replication compartments provide the opportunity for recombination between coinfecting herpesviruses

Enosh Tomer et al. FASEB J. 2019 Aug.

Erratum in

Abstract

Homologous recombination (HR) is considered a major driving force of evolution because it generates and expands genetic diversity. Evidence of HR between coinfecting herpesvirus DNA genomes can be found frequently both in vitro and in clinical isolates. Each herpes simplex virus type 1 (HSV-1) replication compartment (RC) derives from a single incoming genome and maintains a specific territory within the nucleus. This raises intriguing questions about where and when coinfecting viral genomes interact. To study the spatiotemporal requirements for intergenomic recombination, we developed an assay with dual-color FISH that enables detection of HR between different pairs of coinfecting HSV-1 genomes. Our results revealed that HR increases intermingling of RCs derived from different genomes. Furthermore, inhibition of RC movement reduces the rate of HR events among coinfecting viruses. Finally, we observed correlation between nuclear size and the number of RCs per nucleus. Our findings suggest that both viral replication and recombination are subject to nuclear spatial constraints. Other DNA viruses and cellular DNA are likely to encounter similar restrictions.-Tomer, E., Cohen, E. M., Drayman, N., Afriat, A., Weitzman, M. D., Zaritsky, A., Kobiler, O. Coalescing replication compartments provide the opportunity for recombination between coinfecting herpesviruses.

Keywords: DNA recombination; herpes simplex virus; nuclear spatial constraints; viral nuclear interactions.


Conflict of interest statement

The authors thank Eitan Erez Zahavi, Ariel Ionescu, and Eran Perlson for advice and valuable support and all Kobiler lab members for their comments. This work was supported by grants from the Israel Science Foundation (Grant 1387/14) to O.K., the European Union Career Integration Grant (EU CIG) (FP7-2012-333653) to O.K., the U.S. National Institutes of Health (NIH), National Institute of Neurological disorders (NS082240) to M.D.W., the United States - Israel Binational Science Foundation (Grant 2015395) to O.K. and M.D.W., a Marguerite Stolz Research Fellowship to O.K. and E.T. is supported by the Buchman Scholarship, and A.Z. was supported by a Grant from the NIH, National Institute of General Medical Sciences (P01 GM103723) to Gaudenz Danuser (Departments of Bioinformatics and Cell Biology, University of Texas Southwestern Medical Center, Dallas, TX). The funders had no role in study design, data collection and analysis, decision to publish, or preparation of the manuscript. The authors declare no conflicts of interest.

Figures
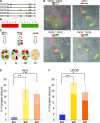
Figure 1
Figure 1
Schematic representation of dual-color FISH assay. A) A series of viral recombinants with 2 unique tag sequences (designated red and green) inserted into various loci of the parental genome. Illustration of the insertion sequences (color boxes) and viral genomes (black line with repeats marked in gray boxes). Illustrations are not to scale. B) Two sets of probes conjugated to distinct fluorophores; each set corresponds to 1 tag sequence. C) Illustration of expected results, in which the gray nucleus contains viral RCs originating from genomes with either 1 tag sequence (red or green), 2 tag sequences (yellow), or no tag sequence (black). The expected results in the case of infection with tag sequences on the same locus of 2 coinfecting genomes (I), with tag sequences on separate loci in 2 coinfected genomes where recombination takes place before DNA replication (II) or following DNA replication (III) and with 2 tag sequences in the same genome (IV). D) Representative images of viral plaques initiating from progeny viruses collected from Vero cells coinfected with different viral recombinants as marked above each image. White arrows indicate early colorless plaques. Scale bars, 100 µm. E, F) Progeny viruses from either Vero (E) or U2OS (F) cells coinfected with the viral recombinants OK35 and OK25 (blue), OK35 and OK32 (yellow), and OK35 and OK26 (orange) were plated for individual plaques and colors quantitated. The percent of dual-color plaques (full) and colorless plaques (stripes) are indicated. The averages are shown from 2 technical repeats in 2 separate experiments. Error bars represent sd. *P < 0.05, **P < 0.01, ***P < 0.001 by t test.
Figure 2
Figure 2
Progeny viruses arising from dual-color plaques. Progeny viruses from Vero (A, B) or U2OS (C) cells coinfected with the viral recombinants OK35 and OK25 (blue), OK35 and OK32 (yellow), and OK35 and OK26 (orange) were plated for individual plaques. From each infection, 10 individual plaques with both fluorescent proteins were picked and replated for individual plaques. A) Representative image from each of the progeny plaques arising from a single individual plaque picked from each coinfection. Scale bars, 100 μm. B, C) For each of the 10 individual plaques, the percent of dual-color progeny plaques is plotted.
Figure 3
Figure 3
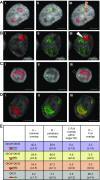
Observed patterns of RC interactions. AD) Representative images of Vero cells infected with viral isolates containing 2 genomic tags, each corresponding to a set of fluorescent probes. The probe sets are imaged separately in red (I), green (II), and merged (III). Four observed patterns of interaction between RCs are represented. A) RCs containing different tag sequences come into contact without overlap (orange arrowhead), imaged from cells infected by 2 viral recombinants containing tag sequences on the same genomic locus (OK25 and OK35). B) RCs containing different tag sequences overlap at their periphery (white arrowhead), imaged from cells infected with 2 viral recombinants containing tag sequences on separate genomic loci (OK32 and OK35). C) RC containing 1 tag sequence overlaps completely within a larger RC with the second tag (black arrowhead) imaged from cells infected with 2 viral recombinants containing tag sequences on separate genomic loci (OK26 and OK35). D) Entirely overlapping RCs, imaged from cells infected by a viral recombinant containing 2 tag sequences on the same genome in separate loci (OK31). DAPI nuclear stain is presented in gray. Scale bars, 5 µm. E) Percent of each of the observed RCs interactions in AD from the total number of RCs interactions. Manually counted at the different coinfection conditions. More than70 RCs interactions per infection type per experiment were counted. An average of 3 experiments and the sd in brackets are shown.
Figure 4
Figure 4
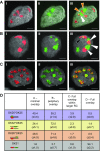
Patterns of RC interactions on U2OS cells. AC) Representative images of U2OS cells infected with either OK25 and OK35 (A), OK32 and OK35 (B), or OK31 (C) viral recombinants. The probe sets are imaged separately in red (I), green (II), and merged (III). Arrowheads are color coded as in Fig. 2. DAPI is presented in gray. Scale bars, 5 µm. D) Percent of each of the observed RCs interactions out of total RCs interactions. Manually counted at the different coinfection conditions. More than 70 RCs interactions per infection type per experiment were counted. An average of 3 experiments and the sd in brackets are shown.
Figure 5
Figure 5
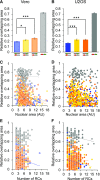
HR enhances overlap between viral genomes. Vero cells (A, C, E) and U2OS cells (B, D, F) were infected with the viral isolates OK35 and OK25 where tags are inserted into the same genomic locus (blue), the viral isolates OK35 and OK32 (yellow) or OK35 and OK26 (orange) containing tags on separate genomic loci, and the viral isolate OK31 containing 2 tag sequences on a single viral genome (gray). A, B) Each column represents the average relative overlapping area calculated from all cells (with detectable overlap) infected under the same condition. C–F) Individual cells were plotted to compare the relative overlapping area to the nuclear area (C, D) or to the number of RCs per cell (E, F). A trend line (color coded as above) was calculated using the ordinary least squares (OLSs) method is presented for each infection condition. All analyses were conducted on images generated from 3 independent experimental repeats done on different days with viral stocks prepared and tittered separately. AU, arbitrary units. *P < 0.05, **P < 0.01, ***P < 0.001 by t test.
Figure 6
Figure 6
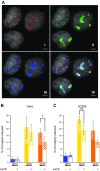
HR occurs where RCs coalesce. A) Representative images of U2OS cells infected with 2 viral isolates containing tag sequences at different genomic loci (OK35 and OK32). The cells were hybridized with 2 probes conjugated to 3 distinct fluorophores. I) Detection of the OK35 tag sequence is shown in red. II) Detection of the OK32 tag sequence is shown in green. III) Detection of the viral a sequence (detect HSV DNA nonspecifically) is shown in blue. IV) Overlays of 3 colors are shown. DAPI is presented in gray. Scale bars, 5 µm. B, C) Vero (B) or U2OS (C) cells were coinfected with the viral recombinants OK35 and OK25 (blue), OK35 and OK32 (yellow), and OK35 and OK26 (orange) in the presence (empty bar) or absence (full bar) of latruncalin B. Progeny viruses from each infection condition were plated for individual plaques and colors were quantitated. The percent of dual-color plaques (full) and colorless plaques (stripes) out of the total observed plaques were measured. The means are shown from 2 technical repeats in 2 separate experiments. Error bars represent sd. *P < 0.05, **P < 0.01, by t test.
Figure 7
Figure 7
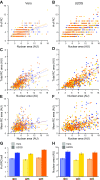
Nuclear size correlates with the number of RCs per cell. Cells were coinfected with the viral recombinants OK35 and OK25 (blue), OK35 and OK32 (yellow), and OK35 and OK26 (orange). A–F) Individual Vero (A, C, E) and U2OS (B, D, F) cells were plotted to compare the number of RCs per cell (A, B), the total area of RCs per cell (C, D), and the average area of each RCs (E, F) to the nuclear area. A trend line (color coded as above) was calculated using the ordinary least squares (OLSs) method is presented for each infection condition. G, H) Comparing the mean number of RCs per cell (G) and the mean nuclear area (H) between Vero (bright colored columns) and U2OS (dark colored columns). All analyses were conducted on images generated from 3 independent experimental repeats done on different days with viral stocks prepared and tittered separately. Error bars represent se of the means. AU, arbitrary units.

References

    1. Muller H. J. (1964) The relation of recombination to mutational advance. Mutat. Res. 106, 2–9 - PubMed
    1. Felsenstein J. (1974) The evolutionary advantage of recombination. Genetics 78, 737–756 - PMC - PubMed
    1. Sanjuán R., Domingo-Calap P. (2016) Mechanisms of viral mutation. Cell. Mol. Life Sci. 73, 4433–4448 - PMC - PubMed
    1. Holmes E. C. (2008) Evolutionary history and phylogeography of human viruses. Annu. Rev. Microbiol. 62, 307–328 - PubMed
    1. Renner D. W., Szpara M. L. (2017) Impacts of genome-wide analyses on our understanding of human herpesvirus diversity and evolution. J. Virol. 92, e00908-17 - PMC - PubMed

Publication types

LinkOut - more resources