. 2019 Sep:129:118-129.
doi: 10.1016/j.nbd.2019.05.009. Epub 2019 May 17.

Pridopidine protects neurons from mutant-huntingtin toxicity via the sigma-1 receptor

Affiliations

Pridopidine protects neurons from mutant-huntingtin toxicity via the sigma-1 receptor

Chelsy R Eddings et al. Neurobiol Dis. 2019 Sep.

Abstract

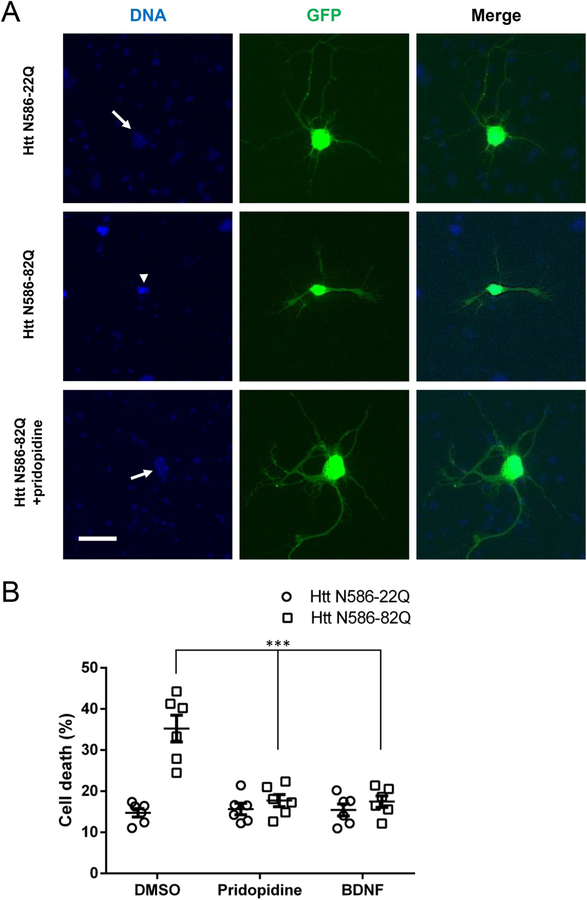
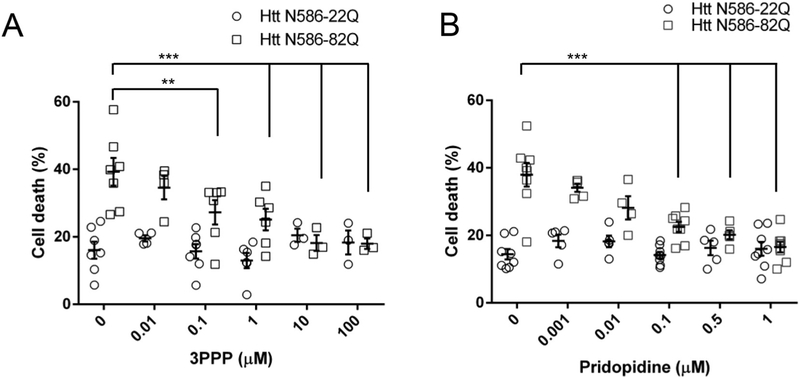
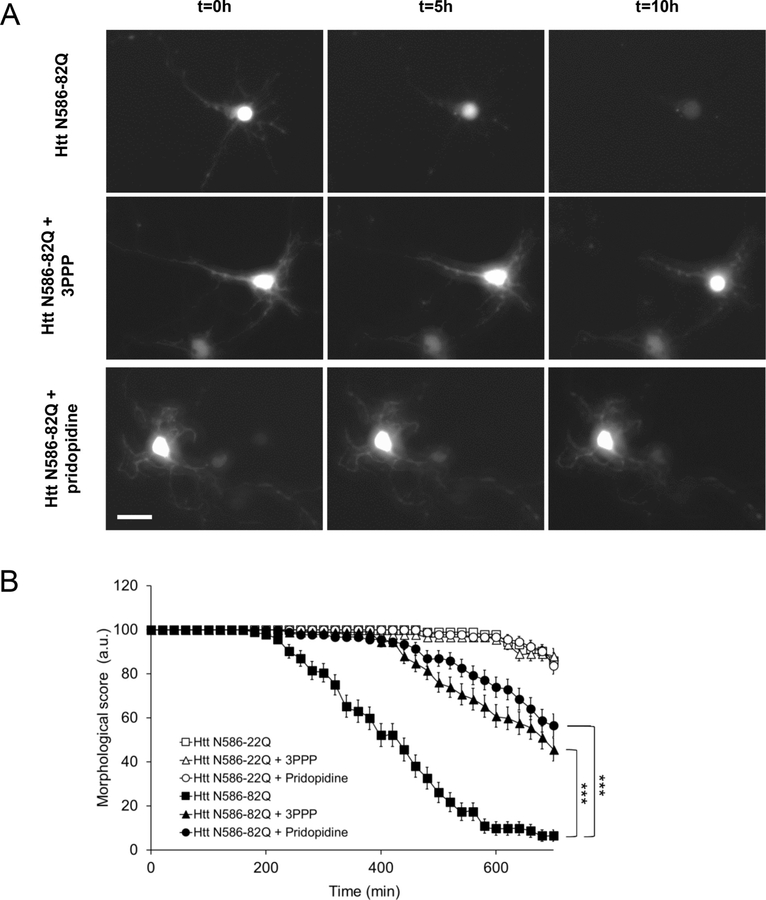
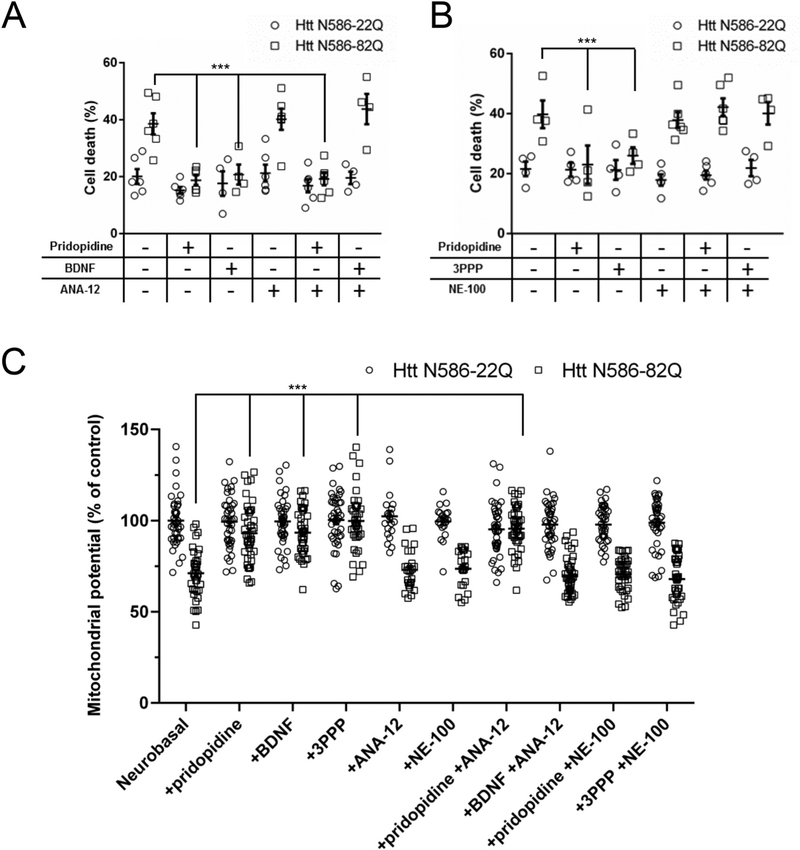
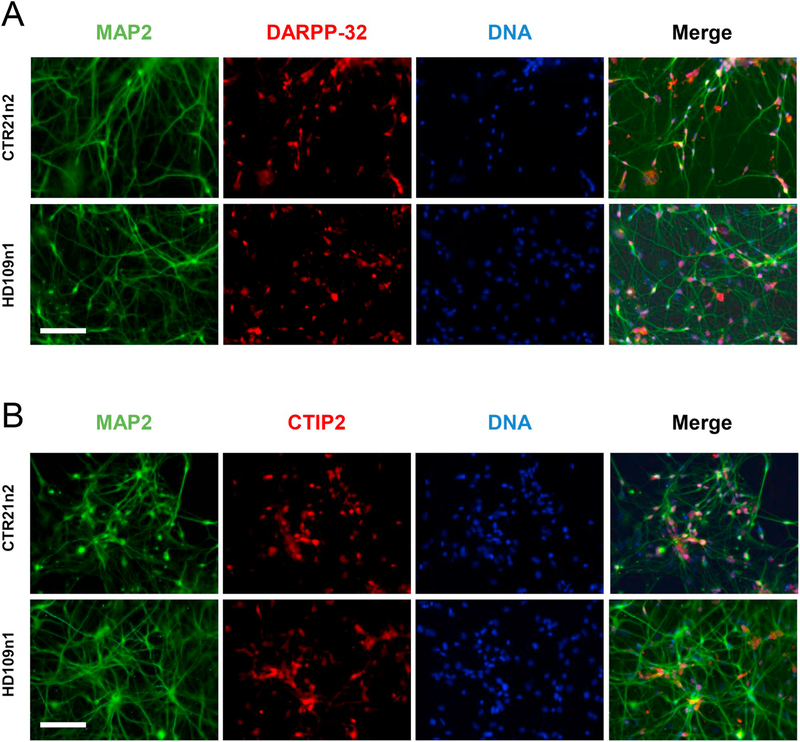
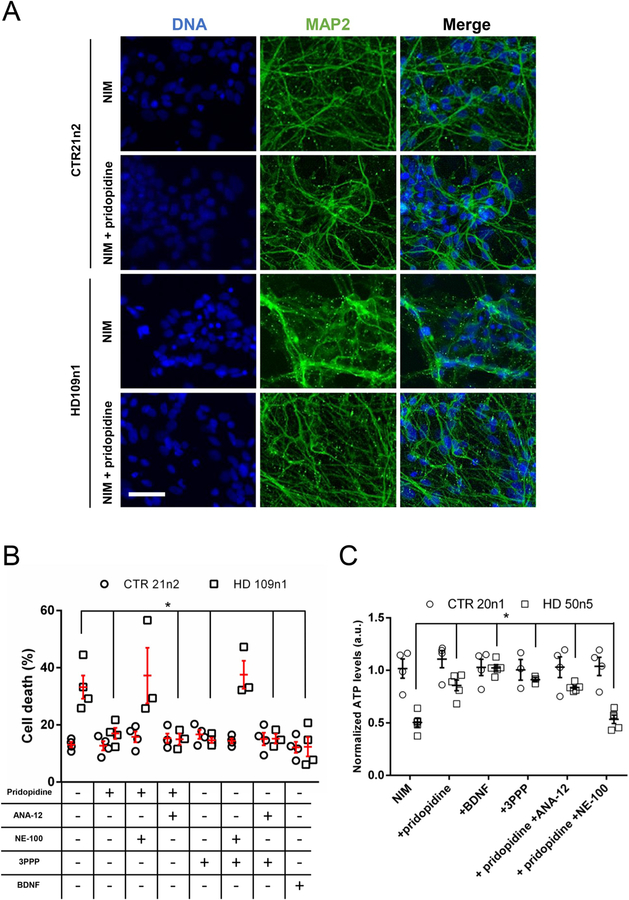
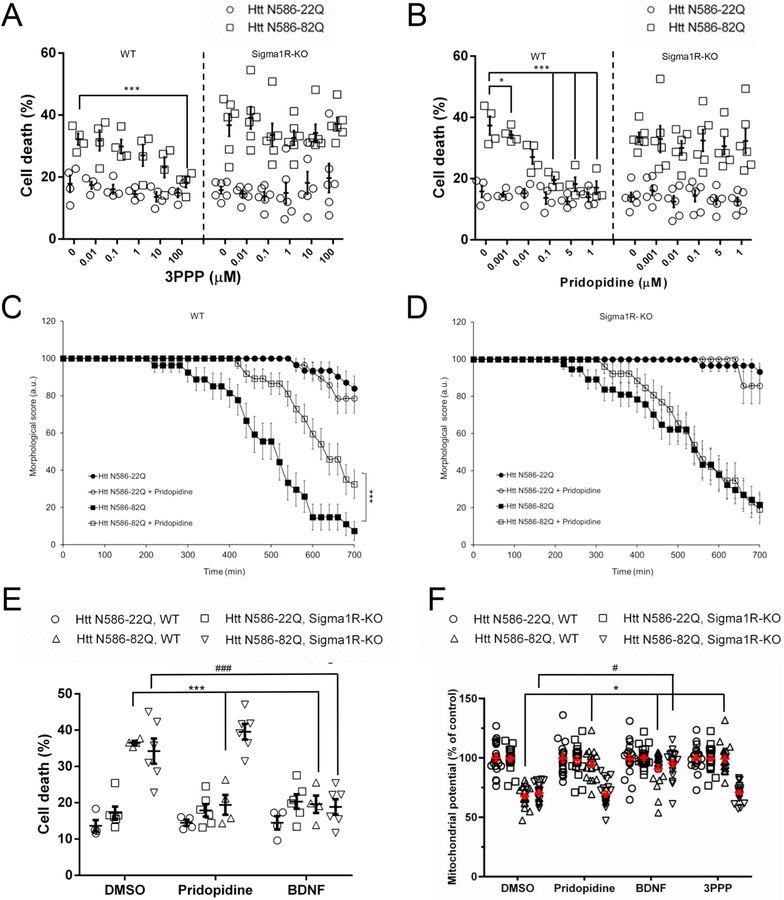
Huntington's disease (HD) is a neurodegenerative disease caused by a CAG repeat expansion in the Huntingtin gene (HTT), translated into a Huntingtin protein with a polyglutamine expansion. There is preferential loss of medium spiny neurons within the striatum and cortical pyramidal neurons. Pridopidine is a small molecule showing therapeutic potential in HD preclinical and clinical studies. Pridopidine has nanomolar affinity to the sigma-1 receptor (sigma-1R), which is located predominantly at the endoplasmic reticulum (ER) and mitochondrial associated ER membrane, and activates neuroprotective pathways. Here we evaluate the neuroprotective effects of pridopidine against mutant Huntingtin toxicity in mouse and human derived in vitro cell models. We also investigate the involvement of the sigma-1 receptor in the mechanism of pridopidine. Pridopidine protects mutant Huntingtin transfected mouse primary striatal and cortical neurons, with an EC50 in the mid nanomolar range, as well as HD patient-derived induced pluripotent stem cells (iPSCs). This protection by pridopidine is blocked by NE-100, a purported sigma-1 receptor antagonist, and not blocked by ANA-12, a reported TrkB receptor antagonist. 3PPP, a documented sigma-1 receptor agonist, shows similar neuroprotective effects. Genetic knock out of the sigma-1 receptor dramatically decreases protection from pridopidine and 3PPP, but not protection via brain derived neurotrophic factor (BDNF). The neuroprotection afforded by pridopidine in our HD cell models is robust and sigma-1 receptor dependent. These studies support the further development of pridopidine, and other sigma-1 receptor agonists as neuroprotective agents for HD and perhaps for other disorders.

Keywords: 3PPP; Huntingtin toxicity; Huntington's disease; Mutant-huntingtin; Neuroprotection; Patient-derived induced pluripotent stem cells; Pridopidine; Primary neurons; Sigma-1 receptor.


Figures

Fig. 1.
Fig. 1.. Pridopidine protects striatal neurons from mutant Huntingtin induced toxicity.
(A) Representative images of GFP transfected striatal neurons. Cells were transfected as stated, treated for 48 h, fixed using 4% paraformaldehyde in PBS, and stained with Hoechst. Healthy non-condensed nuclei (arrow) and apoptotic condensed nuclei (arrowhead) are indicated. Scale bar: 25 μm. (B) Quantification of nuclear condensation assay in striatal neurons. CD1 primary striatal neurons transfected at DIV5 were treated with 1 μM pridopidine or 20 ng/mL BDNF in the culture media for 48 h before nuclei were stained with Hoechst. Quantification of nuclear staining intensity in transfected cells was performed using Volocity. Results presented as individual values plus means ± S.E. of the percentage of dead cells. *** p < .001 vs DMSO, ANOVA with Bonferroni post-hoc test. (n = 6 independent neuronal preparations).
Fig. 2.
Fig. 2.. In nuclear condensation assays, pridopidine protects cortical neurons from mutant Huntingtin toxicity.
(A) Quantification of 3PPP treated cortical neuron cell death. Transfected CD1 primary cortical neurons were treated with a given 3PPP concentration in the culture media for 48 h before nuclei were stained with Hoechst. Quantification of nuclear staining intensity in transfected cells was performed using Volocity. Results presented as individual values plus means ± S.E. of the percentage of dead cells. ** p < .01 vs Htt-82Q untreated cells, *** p < .001 vs Htt-82Q untreated cells, ANOVA with Bonferroni post-hoc test. (n = 8 independent neuronal preparations). (B) Quantification of pridopidine treated cortical neuron cell death. Transfected CD1 primary cortical neurons were treated with a given pridopidine concentration in the culture media for 48 h before nuclei were stained with Hoechst. Quantification of nuclear staining intensity in transfected cells was performed using Volocity. Results presented as individual values plus means ± S.E. of the percentage of dead cells. *** p < .001 vs Htt-82Q untreated cells, ANOVA with Bonferroni post-hoc test. (n = 8 independent neuronal preparations).
Fig. 3.
Fig. 3.. In live cell imaging assays, pridopidine protects cortical neuron morphology from mutant Huntingtin toxicity.
(A) Representative images of GFP transfected neurons after treatment with 1 μM pridopidine or 1 μM 3PPP at 0, 5 and 10 h of live cell imaging. Scale bar: 20 μm. (B) Quantification of cortical neuron death in live cell imaging assay. Transfected CD1 primary cortical neurons were tracked over 10 h using automated picture acquisition performed on a Zeiss Axiovert 200 inverted microscope. Manual classification of cell death was performed, based on neuronal projection disappearance and soma shape change from oval to circular. *** p < .001 vs Htt-82Q untreated cells. Survival analysis was performed using a Gehan-Breslow test to determine a statistical difference between groups, followed by an All Pairwise Multiple Comparison (Holm-Sidak method) to identify the differences between groups. (n = 92 independent cells from 3 independent neuronal preparations).
Fig. 4.
Fig. 4.. A sigma-1 receptor antagonist blocks pridopidine-dependent protection of cortical neurons.
Quantification of cell death in neurons treated with pridopidine in combination with a TrkB (ANA-12 1 μM (A)) or sigma-1 receptor (NE-100 1 μM (B)) antagonist. Transfected CD1 primary cortical neurons were treated with a given compound combination in the culture media for 48 h before nuclei were stained with Hoechst. Quantification of nuclear staining intensity in transfected cells was performed using Volocity. Results presented as individual values plus means ± S.E. of the percentage of dead cells. *** p < .001 vs Htt-82Q untreated cells. ANOVA with Bonferroni post-hoc test. (n = 6 independent neuronal preparations). (C) Quantification of mitochondrial potential using TMRM staining, Average intensity of staining in the soma of transfected cells was measured after 24 h of the indicated treatments. * p < .05 vs Htt N86-82Q by ANOVA with Bonferroni post-hoc test. (n = 4 independent neuronal preparations for a total of 40 independent cells).
Fig. 5.
Fig. 5.. Characterization of differentiated patient-derived induced pluripotent stem cells.
(A) Representative images of differentiated control (CTR21n2) and HD (HD109n1) iPSCs. Cells were stained with Hoechst to visualize nuclei and MAP2 to visualize projections and the medium spiny neuron marker DARPP-32. Scale bar: 150 μm. (B) Representative images of differentiated control (CTR21n2) and HD (HD109n1) iPSCs. Cells were stained with Hoechst to visualize nuclei and MAP2 to visualize projections and the medium spiny neuron marker CTIP2. Scale bar: 150 μm.
Fig. 6.
Fig. 6.. Pridopidine protects patient-derived induced pluripotent stem cells via the sigma-1 receptor.
(A) Representative images of differentiated control (CTR21n2) and HD (HD109n1) iPSCs in NIM and treated with pridopidine. Cells were stained with Hoechst to visualize nuclei and MAP2 to visualize projections. Scale bar: 100 μm. (B) Cell death quantification in iPSCs treated with 1 μM pridopidine or 20 ng/mL BDNF and either 1 μM ANA-12 or 1 μM NE-100. Cells were treated with a given compound combination in NIM for 48 h before being stained and assayed. Quantification of nuclear intensity in transfected cells was performed using Volocity. Results presented as individual values plus means ± S.E. of the percentage of dead cells. * p < .05 vs HD 109n1 untreated cells, ANOVA with SNK post-hoc test. (n = 4 independent 48-well plate preparations). (C) Quantification of ATP levels using CellTiter-glo assay. Results presented as individual values plus means ± S.E. of normalized ATP levels. * p < .05 vs HD 50n5 untreated cells, ANOVA with SNK post-hoc test. (n = 3 to 5 independent 48-well plate preparations).
Fig. 7.
Fig. 7.. Genetic knock-out of the sigma-1 receptor abolishes the protection of cortical neurons by pridopidine treatment.
(A-B) Cell death quantification of 3PPP (A) and pridopidine (B) treated sigma-1 receptor wild type and knockout cortical neurons. Sigma-1 receptor wild type (WT) and knockout (Sigma1R-KO) mouse primary cortical neurons were assayed and quantified as described. Results presented as individual values plus means ± S.E. of the percentage of dead cells. ** p < .01 vs Htt-82Q untreated cells, *** p < .001 vs Htt-82Q untreated cells, ANOVA with Bonferroni post-hoc test. (n = 4 independent WT neuronal preparations and n = 6 independent Sigma1R-KO neuronal preparations). (C-D) Live cell imaging assay of a treatment with 1 μM pridopidine in WT (C) and Sigma1R-KO (D) cortical neurons. Transfected mouse primary cortical neurons were tracked and cell death was quantified as described. *** p < .001 vs Htt-82Q untreated cells. Survival analysis was performed using a Gehan-Breslow test to determine a statistical difference between groups, followed by an All Pairwise Multiple Comparison (Holm-Sidak method) to identify the differences between groups. (n = 70 independent cells from 3 independent neuronal preparations). (E) Quantification of cell death in WT and Sigma1R-KO primary cortical neurons treated with 1 μM pridopidine or 20 ng/mL BDNF. Automated picture acquisition and quantification of nuclear intensity performed as described. Results presented as individual values plus means ± S.E. of the percentage of dead cells. *** p < .001 vs Htt-82Q, WT and #p < .05 vs HttN86–82Q, Sigma1R-KO. ANOVA with Bonferroni post-hoc test. (n = 4 independent WT neuronal preparations and n = 6 independent Sigma1R-KO neuronal preparations). (F) Quantification of mitochondrial potential using TMRM staining, Average intensity of staining in the soma of transfected WT and Sigma1R-KO neurons was measured after 24 h of the indicated treatments. * p < .05 vs Htt N86-82Q, WT and # p < .05 vs Htt N86-82Q, Sigma1R-KO by ANOVA with Bonferroni post-hoc test. (n = 3 independent neuronal preparations for a total of 20 independent cells).

Similar articles

Cited by

References

    1. Albayrak Y, Hashimoto K, 2017. Sigma-1 receptor agonists and their clinical implications in neuropsychiatric disorders. Adv. Exp. Med. Biol 964, 153–161. - PubMed
    1. Allahtavakoli M, Jarrott B, 2011. Sigma-1 receptor ligand PRE-084 reduced infarct volume, neurological deficits, pro-inflammatory cytokines and enhanced anti-inflammatory cytokines after embolic stroke in rats. Brain Res. Bull 85, 219–224. - PubMed
    1. Arbez N, et al., 2017. Post-translational modifications clustering within proteolytic domains decrease mutant huntingtin toxicity. J. Biol. Chem 292, 19238–19249. - PMC - PubMed
    1. Baydyuk M, et al., 2011. Chronic deprivation of TrkB signaling leads to selective late-onset nigrostriatal dopaminergic degeneration. Exp. Neurol 228, 118–125. - PMC - PubMed
    1. Cazorla M, et al., 2011. Identification of a low-molecular weight TrkB antagonist with anxiolytic and antidepressant activity in mice. J. Clin. Invest 121, 1846–1857. - PMC - PubMed

Publication types