. 2019 Jun:24:101214.
doi: 10.1016/j.redox.2019.101214. Epub 2019 May 9.

Cholesterol enrichment in liver mitochondria impairs oxidative phosphorylation and disrupts the assembly of respiratory supercomplexes

Affiliations

Cholesterol enrichment in liver mitochondria impairs oxidative phosphorylation and disrupts the assembly of respiratory supercomplexes

Estel Solsona-Vilarrasa et al. Redox Biol. 2019 Jun.

Abstract

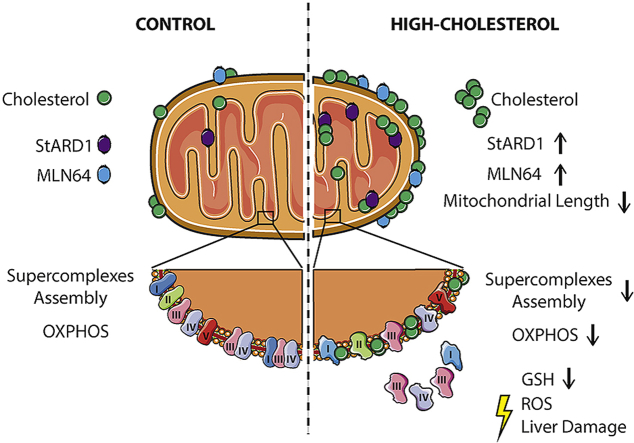
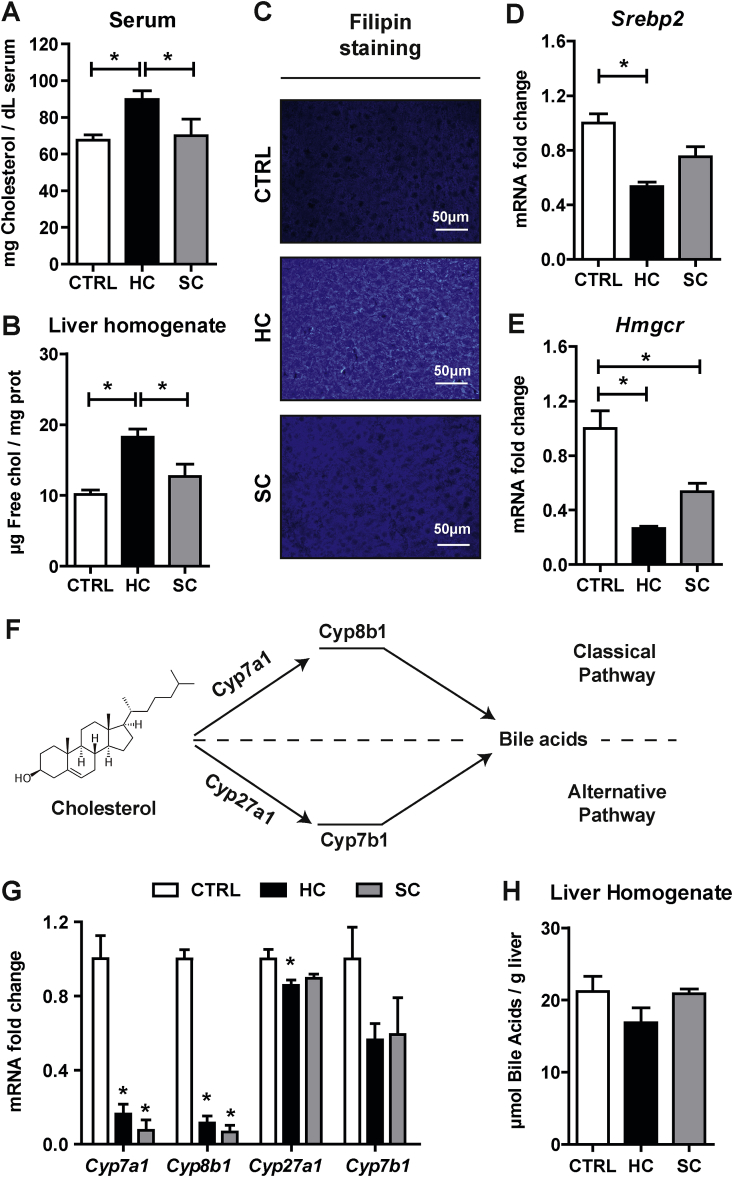
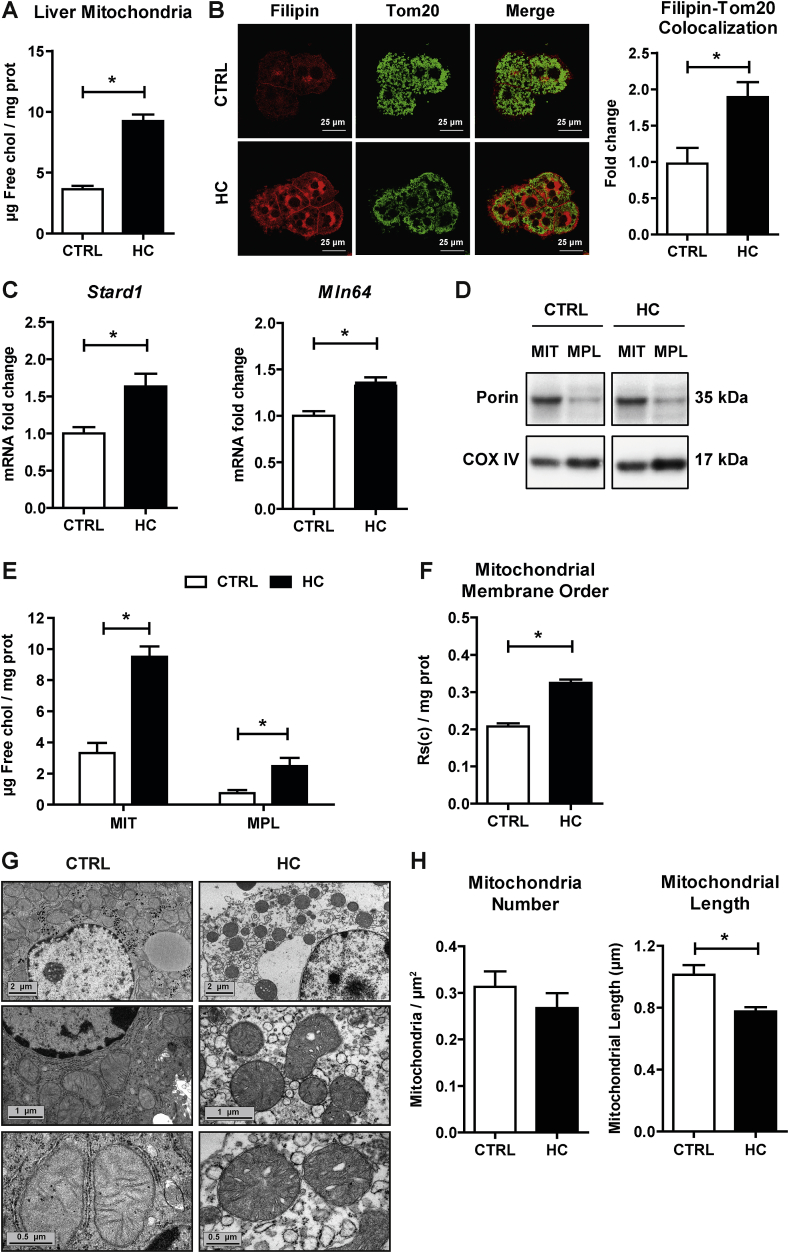
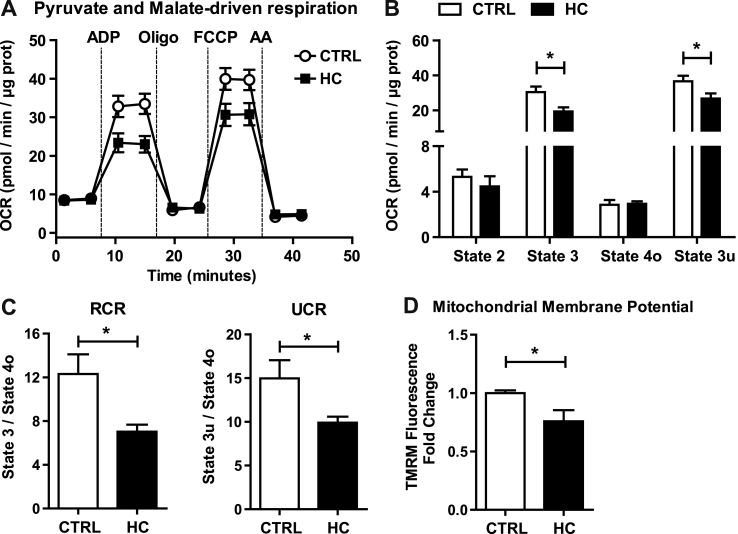
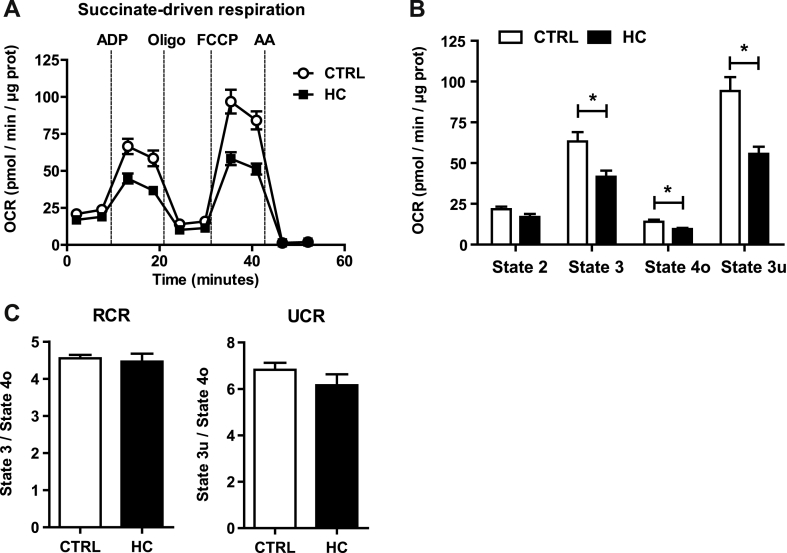
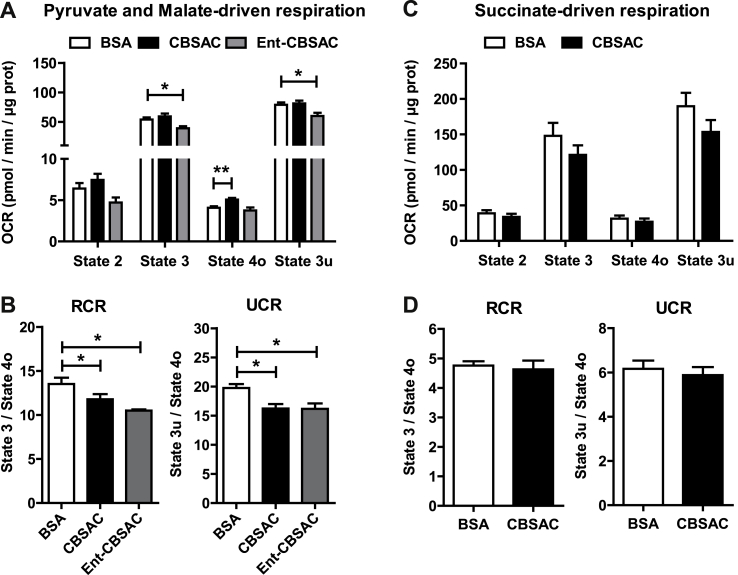
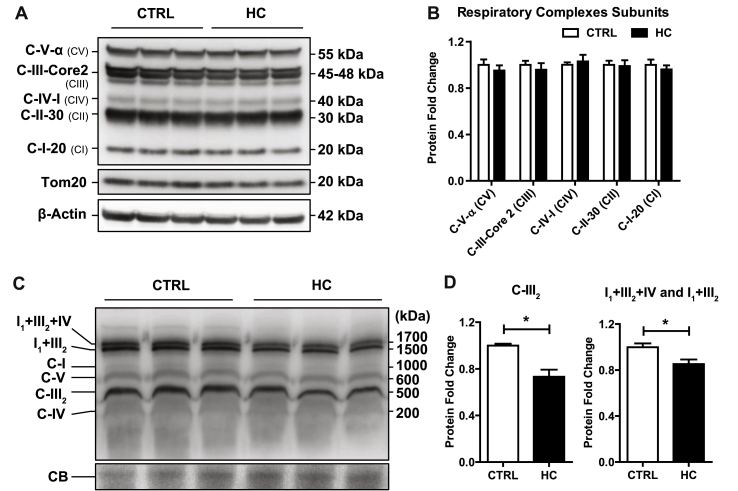
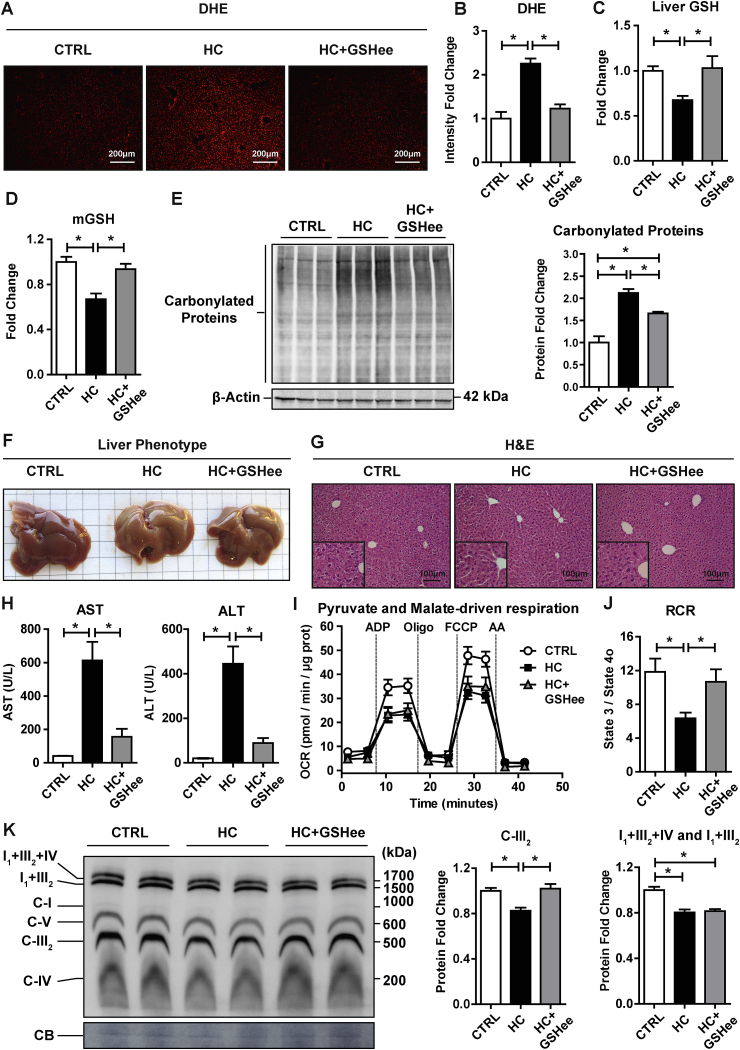
Mitochondrial cholesterol accumulation is a hallmark of alcoholic and non-alcoholic fatty liver diseases and impairs the function of specific solute carriers through changes in membrane physical properties. However, its impact on mitochondrial respiration and organization of respiratory supercomplexes has not been determined so far. Here we fed mice a cholesterol-enriched diet (HC) supplemented with sodium cholate to examine the effect of cholesterol in mitochondrial function. HC feeding increased liver cholesterol content, which downregulated Srebp2 and Hmgcr expression, while sodium cholate administration decreased Cyp7a1 and Cyp8b1 mRNA levels, suggesting the downregulation of bile acid synthesis through the classical pathway. HC-fed mice exhibited increased expression of Stard1 and Mln64 and enhanced mitochondrial free cholesterol levels (2-3 fold), leading to decreased membrane fluidity. Mitochondria from HC-fed mice displayed increased cholesterol loading in both outer and inner mitochondrial membranes. Cholesterol loading decreased complex I and complex II-driven state 3 respiration and mitochondrial membrane potential. Decreased respiratory and uncoupling control ratio from complex I was also observed after in situ enrichment of mouse liver mitochondria with cholesterol or enantiomer cholesterol, the mirror image of natural cholesterol. Moreover, in vivo cholesterol loading decreased the level of complex III2 and the assembly of respiratory supercomplexes I1+III2+IV and I1+III2. Moreover, HC feeding caused oxidative stress and mitochondrial GSH (mGSH) depletion, which translated in hepatic steatosis and liver injury, effects that were rescued by replenishing mGSH with GSH ethyl ester. Overall, mitochondrial cholesterol accumulation disrupts mitochondrial functional performance and the organization of respiratory supercomplexes assembly, which can contribute to oxidative stress and liver injury.

Keywords: Cholesterol; Hepatic diseases; Liver; Mitochondria; Oxidative stress; Respiration.


Figures

Image 1
Graphical abstract
Fig. 1
Fig. 1
Alteration of hepatic cholesterol homeostasis and bile acid synthesis by HC feeding. Cholesterol levels in (A) Serum and (B) Liver of WT C57BL/6J mice fed a CTRL, HC or SC (sodium cholate) diet for 2 days. Data are presented as means ± SEM (N > 10, *P < 0.05, One-way ANOVA followed by Tukey's Multiple Comparison test). (C) Cholesterol content in liver by Filipin staining in liver cryosections. Representative images obtained by fluorescence microscopy. (D–E) mRNA levels of Srebp2 and Hmgcr in liver. Values are the mean ± SEM of >10 animals per group. *P < 0.05. (F) Diagram of classical and alternative pathways of bile acid synthesis in liver. (G) mRNA levels of Cyp7a1, Cyp8b1, Cyp27a1 and Cyp7b1 in liver. Values are the mean ± SEM of >10 animals per group. *P < 0.05 vs. CTRL samples. (H) Bile Acids levels in liver. Data are presented as means ± SEM (N > 5, *P < 0.05, One-way ANOVA followed by Tukey's Multiple Comparison test).
Fig. 2
Fig. 2
Effects of HC feeding on liver mitochondrial cholesterol levels, membrane order and morphology. WT C57BL/6J mice were fed a CTRL or HC diet for 2 days. Cholesterol levels in Mitochondria by (A) HPLC and (B) Immunocytochemistry using Tom20 and Filipin. Staining markers colocalization analyzed using ImageJ software. Data are presented as means ± SEM (N > 10, *P < 0.05, Unpaired Student's t-test (two tailed)). (C) mRNA levels of Stard1 and Mln64 in liver. Values are the mean ± SEM of >10 animals per group. *P < 0.05. (D) Purity of mitoplasts from CTRL and cholesterol-enriched mitochondria (Mitochondria = MIT, Mitoplast = MPL). (E) Levels of cholesterol in mitochondria and mitoplasts by HPLC. (F) Mitochondrial membrane order measured by DPH fluorescence anisotropy. (G) Electron microscopy analyses of livers from mice fed a CTRL or HC diet for 2 days. Images were acquired with a Gatan Orius digital camera by moving randomly across the EM grid and are representative of 3 replicates per group. (H) Mitochondrial number and length of liver samples quantified from images of ultrathin sections (G) and analyzed using ImageJ software. Data are presented as means ± SEM (N = 3, *P < 0.05, Unpaired Student's t-test (two tailed)).
Fig. 3
Fig. 3
Effect of cholesterol in mitochondrial OCR using pyruvate and malate as substrates and membrane potential. WT C57BL/6J mice were fed a CTRL or HC diet for 2 days. (A–B) Respiration of CTRL and cholesterol-enriched mitochondria using XFe24 Seahorse Analyzer. Mitochondria began in a coupled state with pyruvate and malate (10 mM) present (state 2). State 3 initiated with ADP (4 mM) addition, state 4 was induced with the injection of oligomycin (2.5 μg/ml) (state 4o), and FCCP (4 μM) induced maximal uncoupler-stimulated respiration (state 3u). Non-mitochondrial respiration was assessed by OCR measurement in the presence of antimycin (4 μM). (C) Respiratory control ratios (RCR: state 3/state 4o, and UCR: state 3u/state 4o). (D) Mitochondrial Membrane Potential measured by TMRM Fluorescence in a fluorescence spectroscope. Data are presented as means ± SEM (N = 7 or otherwise stated, *P < 0.05, Unpaired Student's t-test (two tailed)).
Fig. 4
Fig. 4
Effect of cholesterol in mitochondrial respiration from succinate and rotenone. WT C57BL/6J mice were fed a CTRL or HC diet for 2 days. (A–B) Respiration of CTRL and cholesterol-enriched mitochondria using XFe24 Seahorse Analyzer. Mitochondria began in a coupled state with succinate (10 mM) and rotenone (2 μM) present (state 2). State 3: ADP (4 mM), State 4o: Oligomycin (2.5 μg/ml), State 3u: FCCP (4 μM), Non-mitochondrial respiration: Antimycin (4 μM). (C) Respiratory control ratios (RCR: state 3/state 4o, and UCR: state 3u/state 4o). Data are presented as means ± SEM (N > 10, *P < 0.05, Unpaired Student's t-test (two tailed)).
Fig. 5
Fig. 5
Impact of in vitro cholesterol enrichment in mitochondrial respiration. Mitochondria from WT C57BL/6J mice fed a CTRL diet were isolated and incubated with natural cholesterol or its enantiomer complexed with BSA (CBSAC and Ent-CBSAC respectively). (A) Pyruvate and Malate-driven mitochondrial respiration. State 2: pyruvate and malate (10 mM), State 3: ADP (4 mM), State 4o: Oligomycin (2.5 μg/ml), State 3u: FCCP (4 μM), Non-mitochondrial respiration: Antimycin (4 μM). (B) Respiratory control ratios (RCR: state 3/state 4o, and UCR: state 3u/state 4o). Values are the mean ± SEM of N > 3 per group. *P < 0.05. One-way ANOVA followed by Tukey's Multiple Comparison test. (C) Succinate and Rotenone-driven mitochondrial respiration. State 2: succinate (10 mM) and rotenone (2 μM), State 3: ADP (4 mM), State 4o: Oligomycin (2.5 μg/ml), State 3u: FCCP (4 μM), Non-mitochondrial respiration: Antimycin (4 μM). (D) Respiratory control ratios (RCR: state 3/state 4o, and UCR: state 3u/state 4o). Data are presented as means ± SEM (N > 3, *P < 0.05, Unpaired Student's t-test (two tailed)).
Fig. 6
Fig. 6
Impairment of mitochondrial supercomplexes assembly by cholesterol enrichment. (A) Protein expression of mitochondrial respiratory complexes subunits from livers of WT C57BL/6J mice fed a CTRL or HC diet for 2 days. β-Actin was used as loading control. Images are representative of at least three independent experiments. (B) Protein Expression quantification of (A) by ImageJ software. Values are the mean ± SEM of >5 animals per group. *P < 0.05 vs. CTRL samples. (C) Blue Native Page electrophoresis of livers from CTRL and HC mice to detect OXPHOS complexes and Supercomplexes expression. Coomassie Blue (CB) staining was used as loading control. Images are representatives of 9 replicates per group. (D) Protein Expression quantification of (C) by ImageJ software. Values are the mean ± SEM of N > 5 animals per group. *P < 0.05. Unpaired Student's t-test (two tailed).
Fig. 7
Fig. 7
Effects of GSHee treatment on HC-induced oxidative stress and liver damage. (A) Reactive oxygen species content in liver tissue by DHE staining. Representative images obtained by fluorescence microscopy. (B) Fluorescence quantification of DHE intensity using ImageJ software. (C–D) GSH levels in liver and mitochondria. Values are the mean ± SEM of >5 animals per group. *P < 0.05. One-way ANOVA followed by Tukey's Multiple Comparison test. (E) Carbonylated proteins from liver sections of CTRL or HC-fed mice with or without GSHee administration in vivo. Results are the mean ± SEM of 3 animals per group. *P < 0.05. One-way ANOVA followed by Tukey's Multiple Comparison test. (F) Macroscopic view of liver after CTRL or HC feeding with or without GSHee treatment. Representative image of >5 replicates is shown. (G) Liver sections of CTRL, HC and HC+GSHee mice analyzed by H&E. (H) Serum AST and ALT levels from CTRL, HC and HC+GSHee mice. Data are presented as means ± SEM (N > 5, *P < 0.05, One-way ANOVA followed by Tukey's Multiple Comparison test). (I) Pyruvate and Malate-driven mitochondrial respiration. State 2: pyruvate and malate (10 mM), State 3: ADP (4 mM), State 4o: Oligomycin (2.5 μg/ml), State 3u: FCCP (4 μM), Non-mitochondrial respiration: Antimycin (4 μM). (J) Respiratory control ratio (RCR: state 3/state 4o) determined from OCR analyzed in I. (K) Blue Native Page electrophoresis of livers from CTRL and HC-fed mice with or without GSHee treatment to detect OXPHOS complexes and Supercomplexes expression. Coomassie Blue (CB) staining was used as loading control. Results are the mean ± SEM of 8 animals per group. *P < 0.05. One-way ANOVA followed by Tukey's Multiple Comparison test. (For interpretation of the references to color in this figure legend, the reader is referred to the Web version of this article.)

Similar articles

Cited by

References

    1. Gimpl G., Burger K., Fahrenholz F. Cholesterol as modulator of receptor function. Biochemistry. 1997;36:10959–10974. - PubMed
    2. Gimpl G., Burger K., Fahrenholz F. Cholesterol as modulator of receptor function. Biochemistry 1997; 36: 10959-10974. - PubMed
    1. Simons K., Ehehalt R. Cholesterol, lipid rafts, and disease. J. Clin. Investig. 2002;110:597–603. - PMC - PubMed
    2. Simons K., Ehehalt R. Cholesterol, lipid rafts, and disease. J Clin Invest 2002; 110:597-603. - PMC - PubMed
    1. Maxfield F.R., Tabas I. Role of cholesterol and lipid organization in disease. Nature. 2005;438:612–621. - PubMed
    2. Maxfield FR., Tabas I. Role of cholesterol and lipid organization in disease. Nature 2005; 438:612-621. - PubMed
    1. Horton J.D., Goldstein J.L., Brown M.S. SREBPs: activators of the complete program of cholesterol and fatty acid synthesis in the liver. J. Clin. Investig. 2002;109:1125–1131. - PMC - PubMed
    2. Horton JD., Goldstein JL., Brown MS. SREBPs: activators of the complete program of cholesterol and fatty acid synthesis in the liver. J Clin Invest 2002; 109: 1125-1131. - PMC - PubMed
    1. Tait S.W., Green D.R. Mitochondria and cell signalling. J. Cell Sci. 2012;125(Pt 4):807–815. - PMC - PubMed
    2. Tait SW., Green DR. Mitochondria and cell signalling. J Cell Sci. 2012; 125(Pt 4):807-815. - PMC - PubMed

Publication types

Substances