. 2019 Sep 1;28(17):2851-2861.
doi: 10.1093/hmg/ddz102.

Site-specific abnormalities in the visual system of a mouse model of CDKL5 deficiency disorder

Affiliations

Site-specific abnormalities in the visual system of a mouse model of CDKL5 deficiency disorder

Leonardo Lupori et al. Hum Mol Genet. .

Abstract

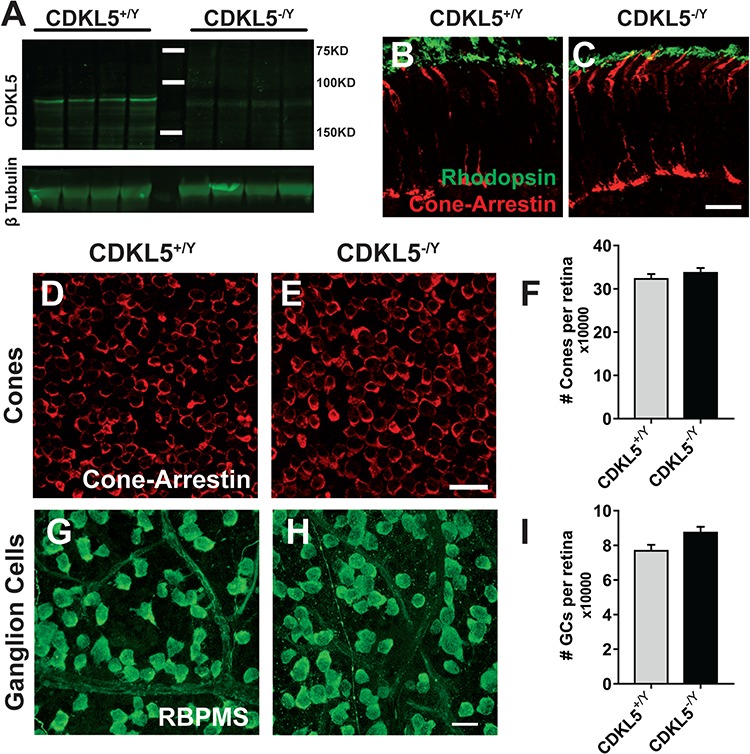
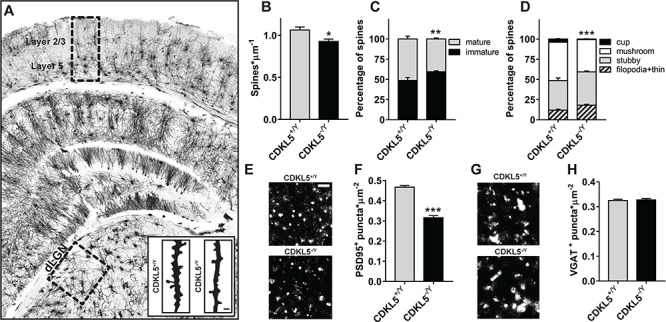
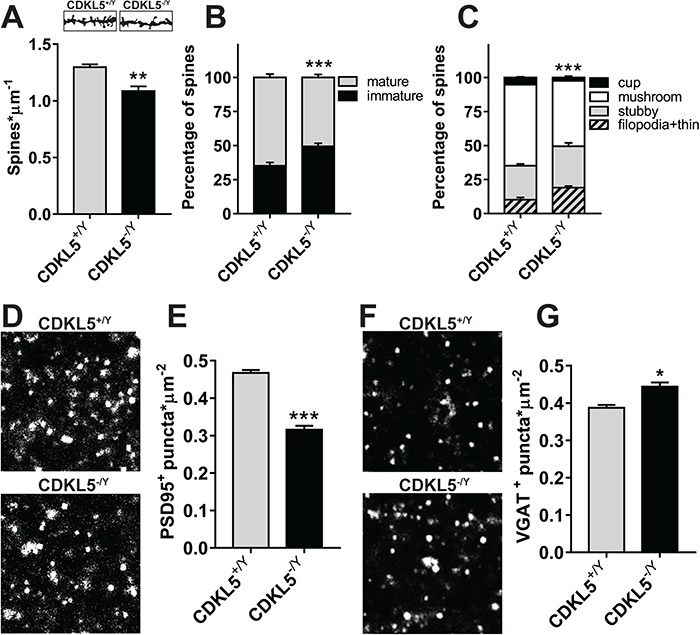
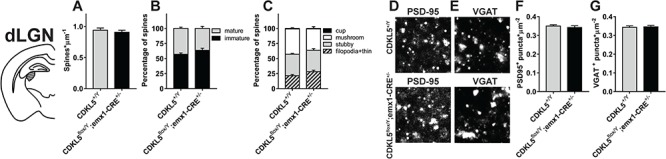
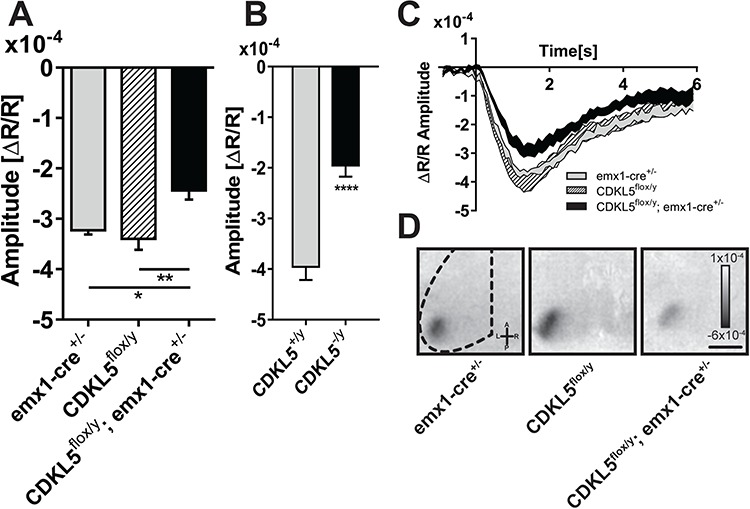
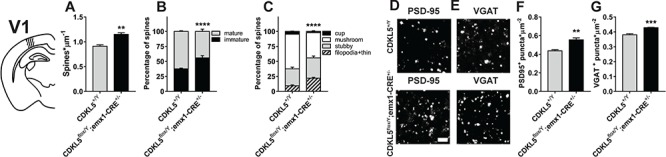
CDKL5 deficiency disorder (CDD) is a neurodevelopmental disorder characterized by a severe global developmental delay and early-onset seizures. Notably, patients show distinctive visual abnormalities often clinically diagnosed as cortical visual impairment. However, the involvement of cerebral cortical dysfunctions in the origin of the symptoms is poorly understood. CDD mouse models also display visual deficits, and cortical visual responses can be used as a robust biomarker in CDKL5 mutant mice. A deeper understanding of the circuits underlying the described visual deficits is essential for directing preclinical research and translational approaches. Here, we addressed this question in two ways: first, we performed an in-depth morphological analysis of the visual pathway, from the retina to the primary visual cortex (V1), of CDKL5 null mice. We found that the lack of CDKL5 produced no alteration in the organization of retinal circuits. Conversely, CDKL5 mutants showed reduced density and altered morphology of spines and decreased excitatory synapse marker PSD95 in the dorsal lateral geniculate nucleus and in V1. An increase in the inhibitory marker VGAT was selectively present in V1. Second, using a conditional CDKL5 knockout model, we showed that selective cortical deletion of CDKL5 from excitatory cells is sufficient to produce abnormalities of visual cortical responses, demonstrating that the normal function of cortical circuits is dependent on CDKL5. Intriguingly, these deficits were associated with morphological alterations of V1 excitatory and inhibitory synaptic contacts. In summary, this work proposes cortical circuit structure and function as a critically important target for studying CDD.


Figures

Figure 1
Figure 1
CDKL5 null mice show normal retinal morphology. (A) Western blot analysis on adult male CDKL5−/y and WT (CDKL5+/y) retinal homogenates showing CDKL5 expression. (B and C) Retinal sections stained for cone photoreceptors (cone arrestin, red) and rod outer segments (rhodopsin, green). The overall structural organization of photoreceptor cells is identical in the two experimental groups. (D and E) Representative images from retinal whole-mount preparations of CDKL5+/y (D) and CDKL5−/y (E) stained for cone arrestin as a cone marker. (F) Quantitation of the total number of cones showed no statistical significance between the two groups (two-tailed Student’s t-test P = 0.435). (G and H) Representative images from retinal whole-mount preparations of CDKL5+/y (G) and CDKL5−/y (H) stained for RBPMS as a RGCs marker. (I) Quantitation of the total number of cones (I) showed no statistical significance between the two groups (two-tailed Student’s t-test P = 0.098). Scale bars are equal to 20 μm. Error bars represent standard error of mean (SEM).
Figure 2
Figure 2
Morphological synaptic abnormalities in CDKL5 KO dLGN. (A) Representative image of a Golgi-stained coronal section containing the dLGN and showing the cortical layering that has been used in sections containing V1. (B) Quantitation of spine density in Golgi-stained dLGN slices showing a reduction in CDKL5−/y mice (two-tailed Student’s t-test P = 0.0259). (C) Quantitation of the relative proportion of mature and immature spines in Golgi-stained dLGN slices showing an increased fraction of immature spines in CDKL5−/y mice (χ2 test P = 0.0027). (D) Quantitation of spine morphology in Golgi-stained dLGN slices showing a pattern of decreased morphological maturity in CDKL5−/y mice (χ2 test P = 0.0009). (E) Representative images of PSD95 punctate staining from CDKL5−/y and CDKL5+/y dLGN. (F) Quantitation of PSD95+ puncta density showing a reduction in CDKL5−/y mice (two-tailed Student’s t-test P < 0.0001). (G) Representative images of VGAT punctate staining from CDKL5−/y and CDKL5+/y dLGN. (H) Quantitation of VGAT+ puncta density showing no difference in CDKL5−/y mice (two-tailed Student’s t-test P = 0.706). *P < 0.05; **P < 0.01; ***P < 0.001. Scale bars (A, insets) are equal to 1 μm; (E and G), 2 μm. Error bars represent SEM.
Figure 3
Figure 3
Morphological synaptic abnormalities in CDKL5 KO V1. (A) Quantitation of spine density in Golgi-stained V1 slices showing a reduction in CDKL5−/y mice (two-tailed Student’s t-test P = 0.026). In the insets are shown representative images of dendritic spines after Golgi staining from CDKL5−/y and CDKL5+/y V1 neurons. (B) Quantitation of the relative proportion of mature and immature spines in Golgi-stained V1 slices showing an increased fraction of immature spines in CDKL5−/y mice (Fisher’s exact test P < 0.001). (C) Quantitation of spine morphology in Golgi-stained V1 slices showing a pattern of decreased morphological maturity in CDKL5−/y mice (χ2 test P < 0.001). (D) Representative images of PSD95 punctate staining from CDKL5−/y and CDKL5+/y V1. (E) Quantitation of PSD95+ puncta density showing a reduction in CDKL5−/y mice (two-tailed Student’s t-test P < 0.001). (F) Representative images of VGAT punctate staining from CDKL5−/y and CDKL5+/y dLGN. (G) Quantitation of VGAT+ puncta density showing an increase in CDKL5−/y mice (two-tailed Student’s t-test P = 0.0135). *P < 0.05; **P < 0.01; ***P < 0.001. Scale bars (D and F) are equal to 2 μm. Error bars represent SEM.
Figure 4
Figure 4
Synaptic morphology in the dLGN and V1 of cKO mice with deletion of CDKL5 in cortical excitatory neurons. (A) Quantitation of spine density in Golgi-stained dLGN slices from cKO (CDKL5flox/y;emx1-CRE+/−) and CDKL5+/y mice showing no significant difference between the two groups (two-tailed Student’s t-test P = 0.528). (B) Quantitation of the relative proportion of mature and immature spines in Golgi-stained dLGN slices showing no difference in the fraction of mature and immature spines in cKO mice compared to WT controls (χ2 test P = 0.0612). (C) Quantitation of spine morphology in Golgi-stained dLGN slices showing no difference in morphological maturity in cKO mice (χ2 test P = 0.163). (D) Representative images of PSD95 punctate staining from cKO and CDKL5+/y dLGN. (E) Representative images of VGAT punctate staining from cKO and CDKL5+/y dLGN. (F) Quantitation of PSD95+ puncta density showing no difference (two-tailed Student’s t-test P = 0.533). (G) Quantitation of VGAT+ puncta density showing no difference (two-tailed Student’s t-test P = 0.812). *P < 0.05; **P < 0.01; ***P < 0.001. Calibration bar is equal to 2 μm. Error bars represent SEM.
Figure 5
Figure 5
Cortical visual responses are impaired in cKO mice with deletion of CDKL5 in cortical excitatory neurons. (A) Quantitation of the average amplitude of the intrinsic signal between the experimental groups, cKO, floxed controls (CDKL5flox/y) and emx1-CRE driver controls (emx1-CRE+/−), showing a significant reduction of the evoked visual responses in cKO mice with respect to both control groups (one-way ANOVA P = 0.004; post hoc Holm–Sidak’s multiple comparisons test, emx1-CRE+/− versus cKO, P = 0.0342; CDKL5flox/y versus cKO, P = 0.0043). (B) Quantitation of the average amplitude of the intrinsic signal in CDKL5 null animals showing a significant reduction with respect to controls (two-tailed Student’s t-test P < 0.001). (C) Average time course of the intrinsic signal in the V1 after visual stimulation for the experimental groups in (A). Each area represents mean ± SEM for all the mice in the group. (D) Representative images of a typical intrinsic signal response to visual stimulation localized in the V1. Dark areas represent active portions of brain tissue. *P < 0.05; **P < 0.01; ***P < 0.001. Scale bar (C) is equal to 1.8 mm. Error bars represent SEM.
Figure 6
Figure 6
(A) Quantitation of spine density in Golgi-stained V1 slices from cKO (CDKL5flox/y;emx1-CRE+/−) and CDKL5+/y mice showing an increase in cKO mice (two-tailed Student’s t-test P = 0.0014). (B) Quantitation of the relative proportion of mature and immature spines in Golgi-stained V1 slices showing an increased fraction of immature spines in cKO mice compared to WT controls (χ2 test P < 0.001). (C) Quantitation of spine morphology in Golgi-stained V1 slices showing a pattern of decreased morphological maturity in cKO mice (χ2 test P < 0.001). (D) Representative images of PSD95 punctate staining from cKO and CDKL5+/y V1. (E) Representative images of VGAT punctate staining from cKO and CDKL5+/y V1. (F) Quantitation of PSD95+ puncta density showing an increase in cKO mice (two-tailed Student’s t-test P = 0.0085). (G) Quantitation of VGAT+ puncta density showing an increase in cKO mice (two-tailed Student’s t-test P < 0.001). *P < 0.05; **P < 0.01; ***P < 0.001. Calibration bar is equal to 2 μm. Error bars represent SEM.

Similar articles

Cited by

References

    1. Amendola E., Zhan Y., Mattucci C., Castroflorio E., Calcagno E., Fuchs C., Lonetti G., Silingardi D., Vyssotski A.L., Farley D. et al. (2014) Mapping pathological phenotypes in a mouse model of CDKL5 disorder. PLoS One, 9(5), e91613. - PMC - PubMed
    1. Barber A.J. and Baccouche B. (2017) Neurodegeneration in diabetic retinopathy: potential for novel therapies. Vision Res., 139(October), 82–92. - PubMed
    1. Boggio E.M., Pancrazi L., Gennaro M., Lo Rizzo C., Mari F., Meloni I., Ariani F., Panighini A., Novelli E., Biagioni M. et al. (2016) Visual impairment in FOXG1-mutated individuals and mice. Neuroscience, 324(June), 496–508. - PubMed
    1. Cang J., Kalatsky V.A., Löwel S. and Stryker M.P. (2005) Optical imaging of the intrinsic signal as a measure of cortical plasticity in the mouse. Vis. Neurosci., 22(5), 685–691. - PMC - PubMed
    1. Chaudhry F.A., Reimer R.J., Bellocchio E.E., Danbolt N.C., Osen K.K., Edwards R.H. and Storm-Mathisen J. (1998) The vesicular GABA transporter, VGAT, localizes to synaptic vesicles in sets of glycinergic as well as GABAergic neurons. J. Neurosci., 18(23), 9733–9750. - PMC - PubMed

Publication types

Supplementary concepts