. 2019 May 17;9(5):251.
doi: 10.3390/ani9050251.

Effects of Graded Dietary Inclusion Level of Full-Fat Hermetia illucens Prepupae Meal in Practical Diets for Rainbow Trout (Oncorhynchus mykiss)

Affiliations

Effects of Graded Dietary Inclusion Level of Full-Fat Hermetia illucens Prepupae Meal in Practical Diets for Rainbow Trout (Oncorhynchus mykiss)

Gloriana Cardinaletti et al. Animals (Basel). .

Abstract

This study investigated the effects of dietary inclusion levels of full-fat Hermetia illucens prepupae meal (H) on growth and gastrointestinal integrity in rainbow trout (Oncorhynchus mykiss). A 98-day study was conducted using triplicate groups of trout (initial body weight, 137 ± 10.5 g) kept in 1-m3 tanks in a flow-through well water system. Three dietary treatments were prepared: one based on fishmeal and purified protein-rich vegetable ingredients (H0), and two experimental diets including graded levels of H meal (25% and 50%, referred to as H25 and H50, respectively). At the end of the feeding trial, no differences were observed in growth performance and plasma metabolite levels, with the biometric data confirmed by the liver expression of the genes involved in somatic growth regulation (igf1 and mstn1a). In the H50 group, a three-fold up regulation of liver hsp70 was observed. An activation of the stress/immune response (il-10, tnf-α, and tlr-5) was observed in medium intestine in the H25 and H50 groups (p < 0.05) together with a villi length reduction detected through histological analyses. Liver histology and Fourier Transform Infrared Imaging (FTIRI) spectroscopy highlighted an increase in lipid deposition. These findings suggest that caution should be taken into account when 50% replacement of conventional ingredients with H is selected.

Keywords: FTIRI spectroscopy; alternative proteins; black soldier fly; feed formulation; gastrointestinal health; growth metrics; plasma metabolite.


Conflict of interest statement

The authors declare no conflict of interest.

Figures

Figure 1
Figure 1
Relative mRNA abundance of genes involved in fish growth (igf1 and mstn1a) and stress (gr and hsp70) analysed in liver from trout fed diets including different H meal levels (H0, H25, H50). (a) igf1. (b) mastn1a. (c) gr. (d) hsp70. Different letters indicate significant differences among the experimental groups (p <0.05). Values are presented as mean ± SD.
Figure 2
Figure 2
Relative mRNA abundance of genes involved in inflammatory response and innate immune defence, analysed in the medium (M.I.) and hind (H.I.) intestine. (a) M.I. il-10. (b) M.I. tnf-α. (c) M.I. tlr-5. (d) H.I. il-10. (e) H.I. tnf-α. (f) M.I. tlr-5. Different letters indicate statistically significant differences among experimental groups (p < 0.05). Values are presented as mean ± SD.
Figure 3
Figure 3
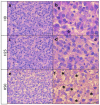
Liver histology of rainbow trout stained with periodic acid of Shiff (PAS). Low and high magnification of sections of liver from group H0 (a,b), H25 (c,d) and H50 (e,f). (Asterisks indicate lipid accumulation. Scale bars: (a,c,e) = 20 μm; (b,d,f) = 10 μm.
Figure 4
Figure 4
Histology of medium (M.I.) and hind (H.I.) intestine from the different feeding groups (H0, H25 and H50). Section were stained with haematoxylin and eosin (HE) and periodic acid of Shiff (PAS). (a) H0 in M.I. HE staining. (b) H0 in M.I. PAS staining. (c) H25 in M.I. HE staining. (d) H25 in M.I. PAS staining. (e) H50 in M.I. HE staining. (f) H50 in M.I. PAS staining. (g) H0 in H.I. HE staining. (h) H0 in H.I. PAS staining. (i) H25 in H.I. HE staining. (j) H25 in H.I. PAS staining. (k) H50 in H.I. HE staining. (l) H50 in H.I. PAS staining. Arrow heads indicate mucous cell hypertrophy. Scale bar = 100 μm.
Figure 5
Figure 5
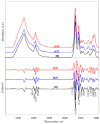
Average spectra of liver sections of rainbow trout fed the test diets: H0 (black), H25 (blue), and H50 (red). Spectra were reported in the 4000–900 cm−1 spectral range in absorbance and second derivative modes (the wavenumbers of the most relevant peaks are reported in the bottom part).
Figure 6
Figure 6
Microphotographs (a) of representative liver sections of H0, H25, and H50 groups analysed by FTIRI and topographical distribution of Lipids (b), Proteins (c), and Glycogen (d). Colours from warm (red) to white indicate higher absorbance values, whilst blue colour indicates the lower ones. See colour scale at the bottom.
Figure 7
Figure 7
Statistical analysis of band area ratios calculated on H0, H25, and H50 liver samples: (a) LIP/TBM (total amount of lipids), (b) CH2/TBM (total amount of saturated alkyl chains), (c) CH2/LIP (saturated alkyl chains with respect to total lipids), (d) PRT/TBM (total amount of proteins), (e) GLY/TBM (total amount of glycogen), and (f) COH/TBM (total amount of carbohydrates). Values are presented as mean ± SD. Different letters indicate statistically significant differences among the experimental groups (p < 0.05).

References

    1. Tacon A., Metian M. Feed matters: Satisfying the feed demand of aquaculture. Rev. Fish. Sci. Aquac. 2015;23:1–10. doi: 10.1080/23308249.2014.987209. - DOI
    1. FAO . The State of World Fisheries and Aquaculture 2018—Meeting the Sustainable Development Goals. FAO; Rome, Italy: 2018. p. 227. Licence: CC BY-NC-SA 3.0 IGO.
    1. Gatlin D., Barrows F., Brown P., Dabrowski K., Gaylord T., Hardy R., Herman E., Hu G., Krogdahl A., Nelson R., et al. Expanding the utilization of sustainable plant products in aquafeeds: A review. Aquacult. Res. 2007;38:551–579. doi: 10.1111/j.1365-2109.2007.01704.x. - DOI
    1. Glencross B.D., Booth M., Allan G.L. A feed is only as good as its ingredients—A review of ingredient evaluation strategies for aquaculture feeds. Aquac Nutr. 2007;13:17–34. doi: 10.1111/j.1365-2095.2007.00450.x. - DOI
    1. Pahlow M., van Oel P., Mekonnen M., Hoekstra A. Increasing pressure on freshwater resources due to terrestrial feed ingredients for aquaculture production. Sci. Total Environ. 2015;536:847–857. doi: 10.1016/j.scitotenv.2015.07.124. - DOI - PubMed

LinkOut - more resources