. 2019 May 17;19(10):2292.
doi: 10.3390/s19102292.

The Multi-Purpose Airborne Sensor Carrier MASC-3 for Wind and Turbulence Measurements in the Atmospheric Boundary Layer

Affiliations

The Multi-Purpose Airborne Sensor Carrier MASC-3 for Wind and Turbulence Measurements in the Atmospheric Boundary Layer

Alexander Rautenberg et al. Sensors (Basel). .

Abstract

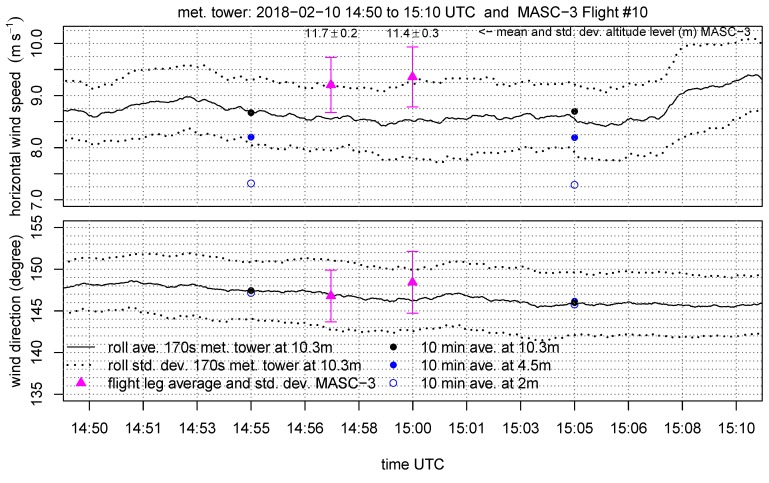
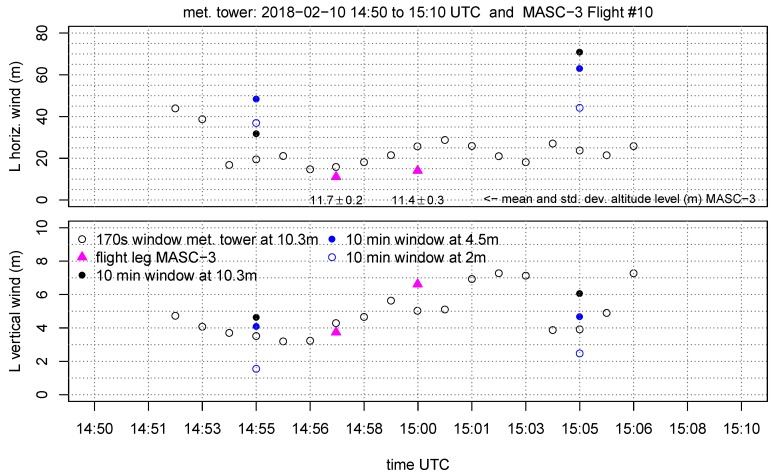
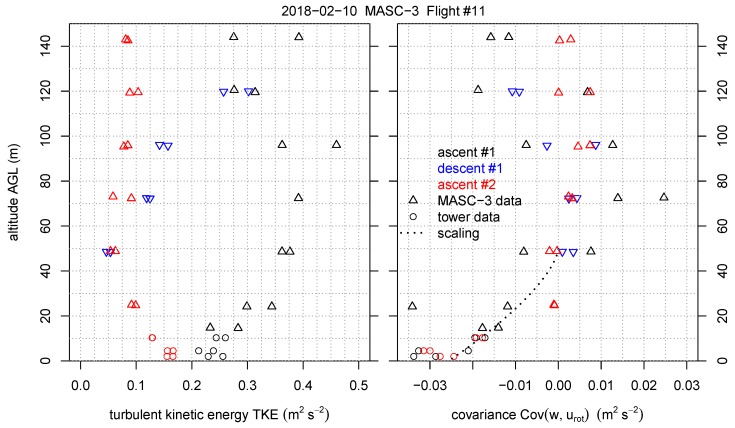
For atmospheric boundary-layer (ABL) studies, unmanned aircraft systems (UAS) can provide new information in addition to traditional in-situ measurements, or by ground- or satellite-based remote sensing techniques. The ability of fixed-wing UAS to transect the ABL in short time supplement ground-based measurements and the ability to extent the data horizontally and vertically allows manifold investigations. Thus, the measurements can provide many new possibilities for investigating the ABL. This study presents the new mark of the Multi-Purpose Airborne Sensor Carrier (MASC-3) for wind and turbulence measurements and describes the subsystems designed to improve the wind measurement, to gain endurance and to allow operations under an enlarged range of environmental conditions. The airframe, the capabilities of the autopilot Pixhawk 2.1, the sensor system and the data acquisition software, as well as the post-processing software, provide the basis for flight experiments and are described in detail. Two flights in a stable boundary-layer and a close comparison to a measurement tower and a Sodar system depict the accuracy of the wind speed and direction measurements, as well as the turbulence measurements. Mean values, variances, covariance, turbulent kinetic energy and the integral length scale agree well with measurements from a meteorological measurement tower. MASC-3 performs valuable measurements of stable boundary layers with high temporal resolution and supplements the measurements of meteorological towers and sodar systems.

Keywords: 3D wind vector measurement; comparison with measurement tower; fixed-wing unmanned aircraft; remotely piloted aircraft (RPA); stable boundary layer; turbulence measurement; unmanned aircraft system (UAS).


Conflict of interest statement

The authors declare no conflict of interest. The founding sponsors had no role in the design of the study; in the collection, analyses, or interpretation of data; in the writing of the manuscript, and in the decision to publish the results.

Figures

Figure 1
Figure 1
Multi-Purpose Airborne Sensor Carrier (MASC-3) sketch (top) and pictures of the airframe with the sensor system (middle) and five-hole probe (bottom).
Figure 2
Figure 2
MASC-3 altitude profile during automatic landing procedure.
Figure 3
Figure 3
MASC-3 flight paths during the Hailuoto-II campaign. The island is indicated in white color and the grey area indicates water, which was completely frozen during the measurements allowing the installation of the indicated measurement tower. The sodar was installed on the island. The flight paths are plotted from the longitude and latitude readings of the inertial navigation system. The flight path section (leg) of Flight #10 and Flight #11 was used for the comparison between the tower, the Sodar and MASC-3. During Flight #10 and Flight #11 the mean wind direction at 100 m above ground level (AGL) is indicated. Map tiles by Stamen Design (http://stamen.com/) under CC BY 3.0 (http://creativecommons.org/licenses/by/3.0). Data by Open Street Map (http://openstreetmap.org/) under ODbL (http://www.openstreetmap.org/copyright).
Figure 4
Figure 4
Data and power flow diagram of the MASC-3 sensor system.
Figure 5
Figure 5
Sensor system hat (left) and mounted electronics inside the sensor hat (right).
Figure 6
Figure 6
Schematic software setup of the sensor system on-board MASC-3.
Figure 7
Figure 7
Meteorological measurement tower during the Hailuoto-II campaign. Viewing direction is north-north-east towards the harbour and the village Marjaniemi. The picture was taken by Kristine Flacké Haualand.
Figure 8
Figure 8
Results of the ogive test between vertical w and the horizontal urot wind components using all observations from the three tower heights during the period 10 February 2018 14:30–22:00 UTC. Ogives are normalized by the value at the point closest to the frequency corresponding to 10 min, indicated by the first vertical dashed line from left. The second vertical dashed line represents the frequency corresponding to 60 s.
Figure 9
Figure 9
Wavenumber spectra (left) and structure functions (right) for the horizontal wind vh (top) and the vertical wind vector component w (bottom). The data of the tower at the 10.3 m level inherits a time series of Δttower=165 s, corresponding to the fetch of the MASC-3 flight leg with a duration of ΔtUAS=77 s. Flight #10 and the first leg at 11.7 m AGL is given.
Figure 10
Figure 10
Time series of the tower with the corresponding leg averages and standard deviation of MASC-3 at the lowest flight levels for the horizontal wind vh (top) and the wind direction ϕ (bottom). The mean altitude and standard deviation of the individual flight leg is given for the MASC-3 data points. The data of the tower at 10.3 m is plotted as rolling (moving) average with standard deviation and a window length of Δttower=170 s corresponding to the fetch of the MASC-3 flight legs with an average duration of ΔtUAS=80 s. Furthermore the neighboring ten minute averages of the tower at all height levels are given.
Figure 11
Figure 11
Time series of the tower with the corresponding leg averages of MASC-3 at the lowest flight levels for the variance of the horizontal wind Varvh (top) and the vertical wind component Varw (bottom). The mean altitude and standard deviation of the individual flight leg is given for the MASC-3 data points. The data of the tower at 10.3 m is calculated on a moving window with a width of Δttower=170 s corresponding to the fetch of the MASC-3 flight legs with an average duration of ΔtUAS=80 s. Furthermore the neighboring ten minute averages of the tower at all height levels are given. The Varw for the first ten minute interval of the tower at 10.3 m and 4.5 m lie on top of each other.
Figure 12
Figure 12
Time series of the tower with the corresponding leg averages of MASC-3 at the lowest flight levels for the turbulent kinetic energy (TKE) (top) and the covariance of the vertical and horizontal wind component Covwurot (bottom). By 2D double rotation for the tower and by coordinate transformation with the mean wind direction of the individual MASC-3 flight legs, urot was aligned with the mean wind direction. The mean altitude and standard deviation of the individual flight leg is given for the MASC-3 data points. The data of the tower at 10.3 m is calculated on a moving window with the length of Δttower=170 s corresponding to the fetch of the MASC-3 flight legs with an average duration of ΔtUAS=80 s. Furthermore the neighboring ten minute averages of the tower at all height levels are given.
Figure 13
Figure 13
Integral length scales of the horizontal wind L(vh) (top) and the the vertical wind component L(w) (bottom). For the tower at 10.3 m, several fractions of the time series with a duration of Δttower=170 s, corresponding to the fetch of the MASC-3 flight legs with an average duration of ΔtUAS=80 s, were used to plot the length scales alongside the values for the individual MASC-3 flight legs. The mean altitude and standard deviation of the individual flight legs are indicated. Furthermore, the integral length scales of the 10 min time series of the tower at all height levels are given.
Figure 14
Figure 14
MASC-3 Flight #11 alongside the corresponding tower data and Sodar data as height profile for the potential temperature θ (left), the horizontal wind speed vh (middle) and the wind direction ϕ (right). The time series of the tower data points have a duration of Δttower=170 s, corresponding to the fetch of the MASC-3 flight legs at the lowest levels with an average duration of ΔtUAS=55 s. The timestamps of the first measurement points of each profile and the timestamps of the Sodar profiles are given.
Figure 15
Figure 15
MASC-3 Flight #11 alongside the corresponding tower data as height profile for the variance of the horizontal wind speed Varvh (left) and the variance of the vertical wind speed Varw (right). The time series of the tower data points have a duration of Δttower=170 s, corresponding to the fetch of the MASC-3 flight legs at the lowest levels with an average duration of ΔtUAS=55 s. The Varw profile (right) inherits the scaling function.
Figure 16
Figure 16
MASC-3 Flight #11 alongside the corresponding tower data as height profile for the TKE (left) and the covariance Covwurot (right) of the vertical wind w and the transformed vector component uh which is aligned with the mean wind direction. The time series of the tower data points have a duration of Δttower=170 s, corresponding to the fetch of the MASC-3 flight legs at the lowest levels with an average duration of ΔtUAS=55 s. The Covwurot profile (right) inherits the scaling function.

References

    1. Taylor G.I. The spectrum of turbulence. Proc. R. Soc. Lond. Ser. A Math. Phys. Sci. 1938;164:476–490. doi: 10.1098/rspa.1938.0032. - DOI
    1. Lumley J. Interpretation of time spectra measured in high-intensity shear flows. Phys. Fluids. 1965;8:1056–1062. doi: 10.1063/1.1761355. - DOI
    1. Kaimal J.C., Finnigan J.J. Atmospheric Boundary Layer Flows: Their Structure and Measurement. Oxford University Press; Oxford, UK: 1994.
    1. Kolmogorov A.N. The local structure of turbulence in incompressible viscous fluid for very large Reynolds numbers. Dokl. Akad. Nauk SSSR. 1941;30:299–303. doi: 10.1098/rspa.1991.0075. - DOI
    1. Cheng Y., Sayde C., Li Q., Basara J., Selker J., Tanner E., Gentine P. Failure of Taylor’s hypothesis in the atmospheric surface layer and its correction for eddy-covariance measurements. Geophys. Res. Lett. 2017;44:4287–4295. doi: 10.1002/2017GL073499. - DOI

LinkOut - more resources