

Transcriptome and Proteome Profiling of Different Colored Rice Reveals Physiological Dynamics Involved in the Flavonoid Pathway
- PMID: 31109052
- PMCID: PMC6566916
- DOI: 10.3390/ijms20102463
Transcriptome and Proteome Profiling of Different Colored Rice Reveals Physiological Dynamics Involved in the Flavonoid Pathway
Abstract
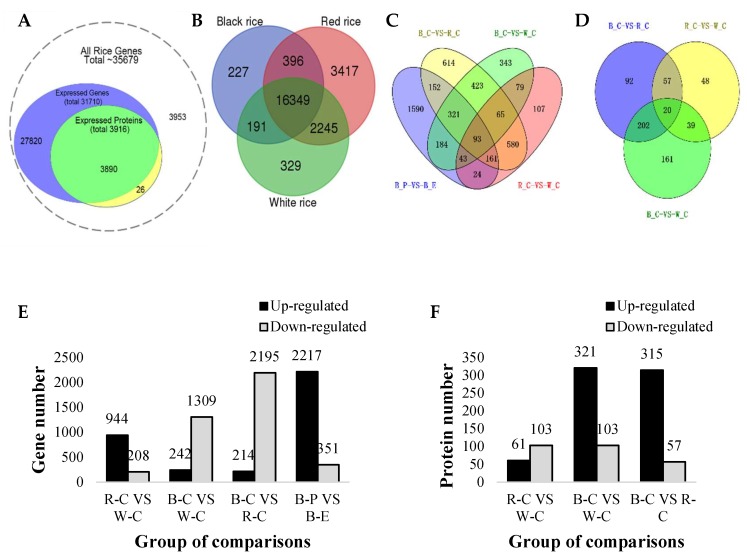
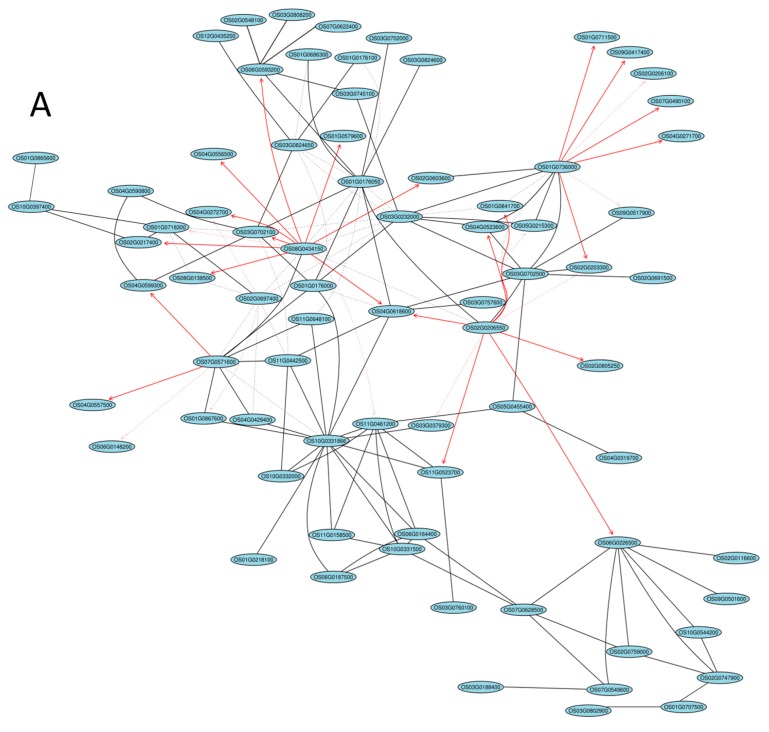
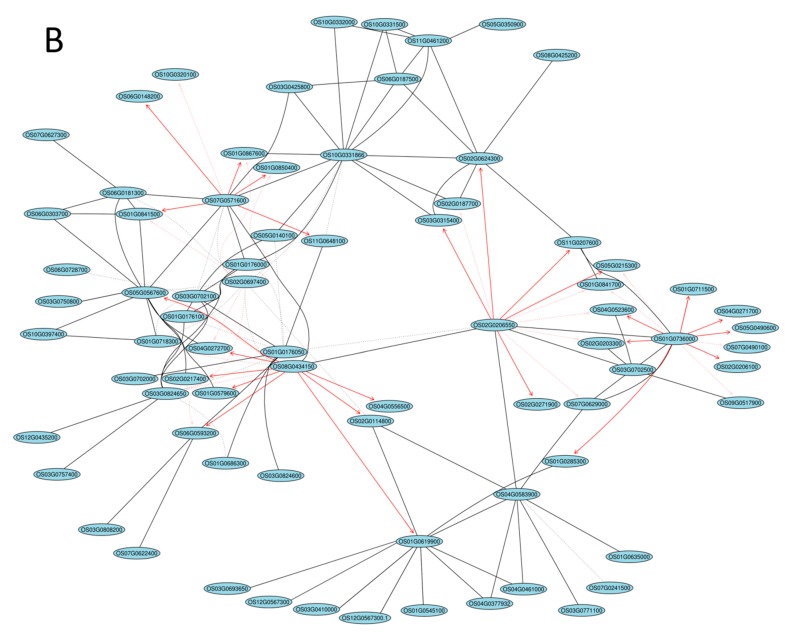
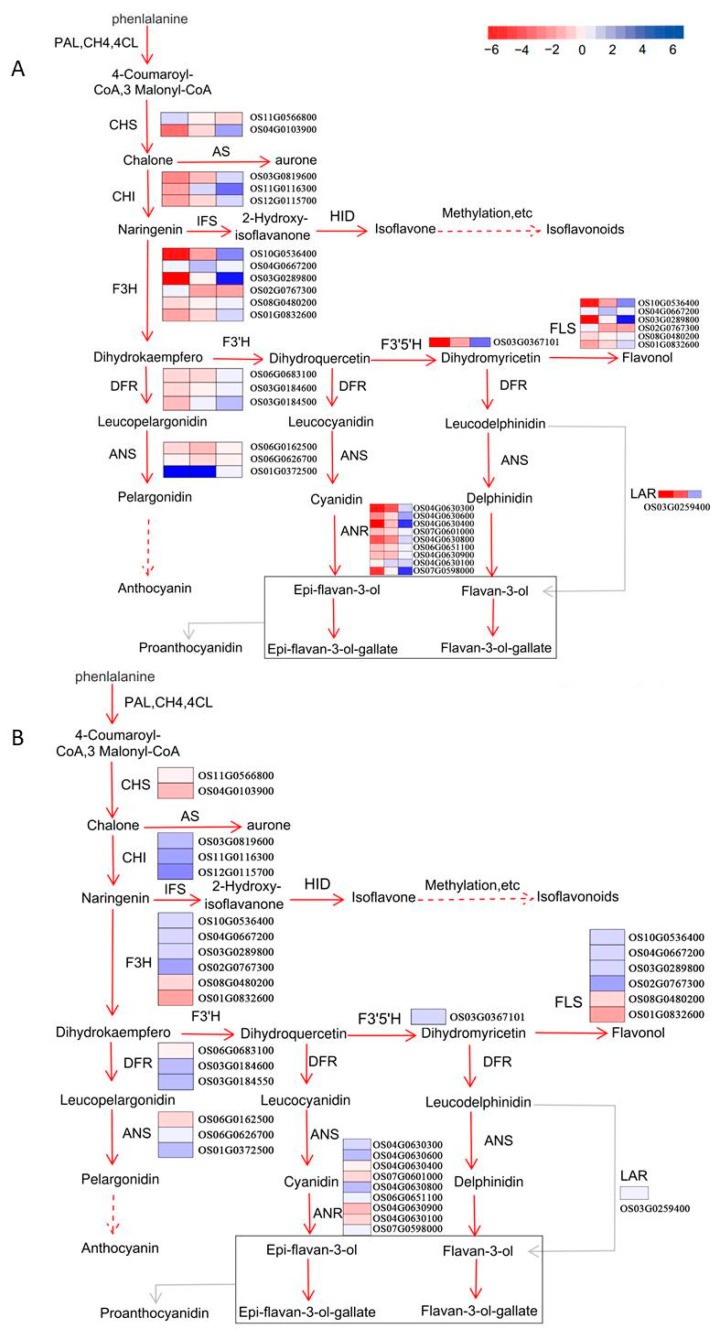
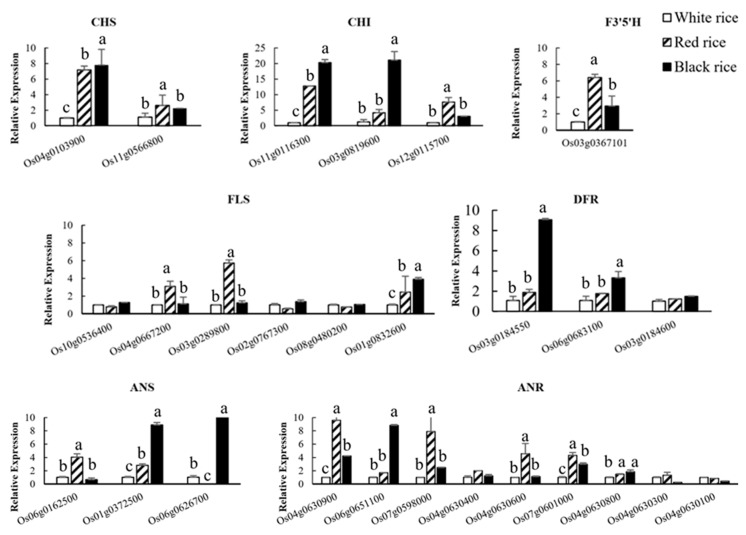
Black and red rice are rich in both anthocyanin and proanthocyanin content, which belong to a large class of flavonoids derived from a group of phenolic secondary metabolites. However, the molecular pathways and mechanisms underlying the flavonoid biosynthetic pathway are far from clear. Therefore, this study was undertaken to gain insight into physiological factors that are involved in the flavonoid biosynthetic pathway in rice cultivars with red, black, and white colors. RNA sequencing of caryopsis and isobaric tags for relative and absolute quantification (iTRAQ) analyses have generated a nearly complete catalog of mRNA and expressed proteins in different colored rice cultivars. A total of 31,700 genes were identified, of which 3417, 329, and 227 genes were found specific for red, white, and black rice, respectively. A total of 13,996 unique peptides corresponding to 3916 proteins were detected in the proteomes of black, white, and red rice. Coexpression network analyses of differentially expressed genes (DEGs) and differentially expressed proteins (DEPs) among the different rice cultivars showed significant differences in photosynthesis and flavonoid biosynthesis pathways. Based on a differential enrichment analysis, 32 genes involved in the flavonoid biosynthesis pathway were detected, out of which only CHI, F3H, ANS, and FLS were detected by iTRAQ. Taken together, the results point to differences in flavonoid biosynthesis pathways among different colored rice cultivars, which may reflect differences in physiological functions. The differences in contents and types of flavonoids among the different colored rice cultivars are related to changes in base sequences of Os06G0162500, Os09G0455500, Os09G0455500, and Os10G0536400. Current findings expand and deepen our understanding of flavonoid biosynthesis and concurrently provides potential candidate genes for improving the nutritional qualities of rice.
Keywords: Oryza sativa L.; black rice; flavonoid biosynthesis; iTRAQ; red rice; transcriptome sequencing.
Conflict of interest statement
The authors declare no conflict of interest. The funders had no role in the design of the study; in the collection, analyses, or interpretation of data; in the writing of the manuscript, or in the decision to publish the results.
Figures
Similar articles
-
iTRAQ-Based Quantitative Proteomics Analysis of Black Rice Grain Development Reveals Metabolic Pathways Associated with Anthocyanin Biosynthesis.PLoS One. 2016 Jul 14;11(7):e0159238. doi: 10.1371/journal.pone.0159238. eCollection 2016. PLoS One. 2016. PMID: 27415428 Free PMC article.
-
Integrated Metabolomic and Transcriptomic Analysis Reveals Differential Mechanism of Flavonoid Biosynthesis in Two Cultivars of Angelica sinensis.Molecules. 2022 Jan 4;27(1):306. doi: 10.3390/molecules27010306. Molecules. 2022. PMID: 35011537 Free PMC article.
-
Integrated Metabolomics and Transcriptomics Analysis of Flavonoid Biosynthesis Pathway in Polygonatum cyrtonema Hua.Molecules. 2024 May 10;29(10):2248. doi: 10.3390/molecules29102248. Molecules. 2024. PMID: 38792110 Free PMC article.
-
Metabolomic analysis of flavonoid diversity and biosynthetic pathways in whole grains.Food Res Int. 2025 Jun;211:116359. doi: 10.1016/j.foodres.2025.116359. Epub 2025 Apr 22. Food Res Int. 2025. PMID: 40356159 Review.
-
Composition and Biological Activity of Colored Rice-A Comprehensive Review.Foods. 2025 Apr 17;14(8):1394. doi: 10.3390/foods14081394. Foods. 2025. PMID: 40282795 Free PMC article. Review.
Cited by
-
Discovery of Functional SNPs via Genome-Wide Exploration of Malaysian Pigmented Rice Varieties.Int J Genomics. 2019 Oct 10;2019:4168045. doi: 10.1155/2019/4168045. eCollection 2019. Int J Genomics. 2019. PMID: 31687375 Free PMC article.
-
Profiling of Nutraceuticals and Proximates in Peanut Genotypes Differing for Seed Coat Color and Seed Size.Front Nutr. 2020 Apr 15;7:45. doi: 10.3389/fnut.2020.00045. eCollection 2020. Front Nutr. 2020. PMID: 32351969 Free PMC article.
-
Integrative transcriptome and proteome analyses provide new insights into different stages of Akebia trifoliata fruit cracking during ripening.Biotechnol Biofuels. 2020 Aug 20;13:149. doi: 10.1186/s13068-020-01789-7. eCollection 2020. Biotechnol Biofuels. 2020. PMID: 32843898 Free PMC article.
-
Comparative Metabolic Profiling of Different Colored Rice Grains Reveals the Distribution of Major Active Compounds and Key Secondary Metabolites in Green Rice.Foods. 2024 Jun 17;13(12):1899. doi: 10.3390/foods13121899. Foods. 2024. PMID: 38928840 Free PMC article.
-
Comparison of the Phenotypic Performance, Molecular Diversity, and Proteomics in Transgenic Rice.Plants (Basel). 2022 Dec 29;12(1):156. doi: 10.3390/plants12010156. Plants (Basel). 2022. PMID: 36616286 Free PMC article.
References
-
- Russo A., La Fauci L., Acquaviva R., Campisi A., Raciti G., Scifo C., Renis M., Galvano G., Vanella A., Galvano F. Ochratoxin A-induced DNA damage in human fibroblast: Protective effect of cyanidin 3-O-beta-d-glucoside. J. Nutr. Biochem. 2005;16:31–37. doi: 10.1016/j.jnutbio.2004.05.005. - DOI - PubMed
MeSH terms
Substances
Grants and funding
LinkOut - more resources
Full Text Sources
