. 2019 May 20;14(3):031001.
doi: 10.1116/1.5090396.

Calcium phosphate nanoparticles as intrinsic inorganic antimicrobials: In search of the key particle property

Affiliations

Calcium phosphate nanoparticles as intrinsic inorganic antimicrobials: In search of the key particle property

Vuk Uskoković et al. Biointerphases. .

Abstract

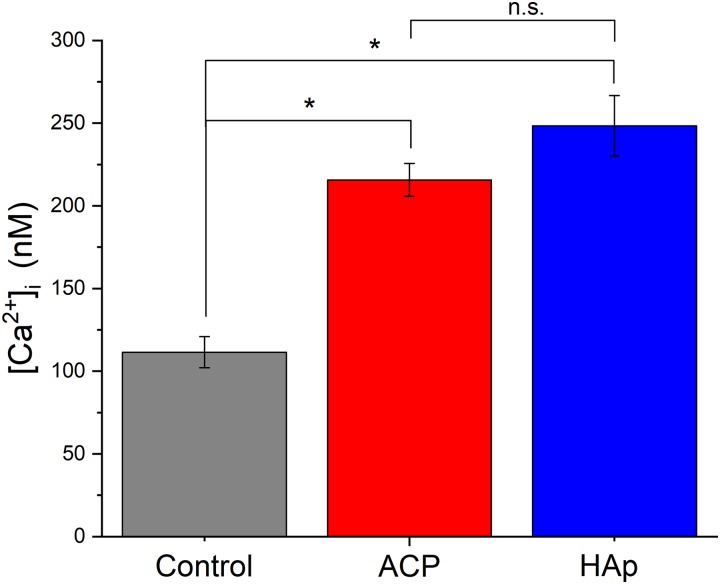
One of the main goals of materials science in the 21st century is the development of materials with rationally designed properties as substitutes for traditional pharmacotherapies. At the same time, there is a lack of understanding of the exact material properties that induce therapeutic effects in biological systems, which limits their rational optimization for the related medical applications. This study sets the foundation for a general approach for elucidating nanoparticle properties as determinants of antibacterial activity, with a particular focus on calcium phosphate nanoparticles. To that end, nine physicochemical effects were studied and a number of them were refuted, thus putting an end to frequently erred hypotheses in the literature. Rather than having one key particle property responsible for eliciting the antibacterial effect, a complex synergy of factors is shown to be at work, including (a) nanoscopic size; (b) elevated intracellular free calcium levels due to nanoparticle solubility; (c) diffusivity and favorable electrostatic properties of the nanoparticle surface, primarily low net charge and high charge density; and (d) the dynamics of perpetual exchange of ultrafine clusters across the particle/solution interface. On the positive side, this multifaceted mechanism is less prone to induce bacterial resistance to the therapy and can be a gateway to the sphere of personalized medicine. On a more problematic side, it implies a less intense effect compared to single-target molecular therapies and a difficulty of elucidating the exact mechanisms of action, while also making the rational design of theirs for this type of medical application a challenge.


Figures

F<sc>ig</sc>. 1.
Fig. 1.
SEM images and XRD patterns of ACP (a) and HAp (b) nanoparticles. Diffraction peaks labeled with • originate from HAp.
F<sc>ig</sc>. 2.
Fig. 2.
Time-dependent release of free calcium ions due to dissolution of different CP phases at 1 mg/ml (a) and solubility in a solution equilibrated after aging the precipitate for 3 h (b). Data points represent averages (n = 3) and error bars represent the standard deviation. Comparison of P. aeruginosa (c) and S. aureus (d) viabilities in the 4–40 mM range of CaCl2 and in the 10–100 mg/ml range of ACP. Data points represent averages (n = 4) and error bars represent the standard deviation. Arrows in (c) and (d) denote abscissas that the individual curves correspond to.
F<sc>ig</sc>. 3.
Fig. 3.
Intracellular free Ca2+ concentration in control E. coli populations and populations challenged with 60 mg/ml ACP or HAp measured using the Fura-2 assay. Data points represent averages (n = 3) and error bars represent the standard deviation. Data points statistically significantly lower (p < 0.05) compared to other data points are marked with an asterisk. Data points statistically insignificantly different (p > 0.05) compared to other data points are marked with “n.s.”
F<sc>ig</sc>. 4.
Fig. 4.
(a) Zeta potential vs pH titration curves for HAp and ACP colloids in the 3.5–12 pH range. Phosphate buffered saline (1x), containing 137 mM NaCl, 2.7 mM KCl, 10 mM Na2HPO4, and 1.8 mM KH2PO4, was used as the medium. Dissolution range is entered at pH < 4, while PZC stands for the point of zero charge. Data points represent averages (n = 3) and error bars represent the standard error of the mean (SD/n1/2). (b) Comparative curves showing the reduction in the concentration of bacterial CFU with the concentration of HAp or ACP in broths for one Gram-negative clinical strain, namely, MDR P. aeruginosa, and one Gram-positive lab strain, namely, S. aureus.
F<sc>ig</sc>. 5.
Fig. 5.
Absolute (a) and differential, dy/dt (b) change in the pH of the supernatant in a 20 mg/ml dispersion of different CP nanopowders in water at 37 °C over time. Dashed lines in (a) and (b) denote the neutral pH at 37 °C and the zero change in pH over time, respectively. Full and empty red circles denote data points for DCP not subjected and subjected to the thermal treatment (bringing of the precipitate to boil), respectively. Data points represent averages (n = 3) and error bars represent the standard deviation.
F<sc>ig</sc>. 6.
Fig. 6.
Reduction in the concentration of colony forming units of S. aureus (a), E. coli (b), or P. aeruginosa (c) in broths treated with ACP or DCP nanoparticles in the 0–100 mg/ml concentration range. Data points represent averages (n = 3) and error bars represent the standard deviation.
F<sc>ig</sc>. 7.
Fig. 7.
Comparative particle size distribution histograms [(a) and (b)] and average particles sizes (c) for HAp [(a) and (c)] and ACP [(b) and (c)] powders and dry cements, and the comparison of the concentration of P. aeruginosa colony forming units per ml of the bacterial broth treated with HAp powders or dry cements at the concentrations of 10, 50, and 100 mg/ml. Data points represent averages (n = 3) and error bars represent standard error of the mean in (c) and standard deviation in (d). Data points statistically significantly lower (p < 0.05) compared to the control, untreated population are marked with an asterisk.
F<sc>ig</sc>. 8.
Fig. 8.
Broth concentration of colony forming units of P. aeruginosa treated synergistically with different concentrations of ACP or HAp nanoparticles and 100 mg/ml of vancomycin. Data points represent averages (n = 3) and error bars represent the standard deviation. Different levels of statistically significantly difference between the concentration of colony forming units in HAp- and ACP-treated broths are marked with * if significant (p < 0.05), ** if highly significant (p < 0.001), or *** if extremely significant (p < 0.0001).
F<sc>ig</sc>. 9.
Fig. 9.
UV–Vis diffuse reflectance spectra of ACP and HAp (a). Kubelka–Munk curves from which the bandgap energies for ACP and HAp were determined by extrapolation [(b) and (c)]. Luminescence photographs of ACP and HAp powders under 405 nm irradiation in the dark [(d) and (e)]. Photoluminescence spectra of ACP and HAp under different excitations [(e) and (f)].
F<sc>ig</sc>. 10.
Fig. 10.
Broth concentration of colony forming units of P. aeruginosa aged overnight after the 5 min treatment with the MIC50 (90 mg/ml) of ACP with (ACP + UV) and without (ACP) the concomitant UV irradiation compared to the broths treated with UV light alone (UV) and broths not subjected to any treatment (control). Data points represent averages (n = 3) and error bars represent the standard deviation. Data points statistically significantly lower (p < 0.05) compared to the control, untreated population are marked with an asterisk.
F<sc>ig</sc>. 11.
Fig. 11.
Reduction in the broth concentration of colony forming units of P. aeruginosa after the treatment with 5 mg/ml of ACP powder compared to the untreated, negative control (a). No inhibition zone forming around 5 mg of ACP powder deposited on an agar plate inoculated with P. aeruginosa and distinct zones of inhibition forming around rifampicin and rifampicin-loaded ACP (b). Moderate zones of inhibition forming around 5 mg of ACP cements deposited on an agar plate inoculated with P. aeruginosa (c).
F<sc>ig</sc>. 12.
Fig. 12.
Kinetic profiles for three different molecules—fluorescein (a), bovine serum albumin (b), and ciprofloxacin (c)—released from HAp or ACP powders [(a) and (b)] or gels (c). The amounts of three different antibiotics—ampicillin (d), vancomycin (e), and erythromycin (f)—loaded and released within 24 h from ACP and HAp and normalized to the weight of ACP/HAp.
F<sc>ig</sc>. 13.
Fig. 13.
Comparison in the reduction of the concentration of colony forming units in E. coli [(a), (b), and (d)] or P. aeruginosa (c) bacterial broths treated with different concentrations of 10 mg/ml HAp or ACP nanoparticles delivered as wet or dried cements (a), HAp nanoparticles prepared with and without the boiling step and involving different precipitate aging times in the solution (b), HAp or ACP nanoparticles delivered as powders or as wet cements (c), and ACP nanoparticles either freshly precipitated or aged in the solution for 3 h (d). Data points represent averages (n = 3) and error bars represent the standard deviation. Data points statistically significantly lower (p < 0.05) compared to the control, untreated population are marked with an asterisk.
F<sc>ig</sc>. 14.
Fig. 14.
SEM images of HAp nanoparticles synthesized by the addition of an NH4H2PO4 solution into a Ca(NO3)2 solution (P → Ca) (a) or by the addition of a Ca(NO3)2 solution into an NH4H2PO4 solution (Ca → P) (b). Viability reduction of different bacterial populations, including E. coli, P. aeruginosa, and S. aureus, in response to the treatment of HAp nanoparticles in doses of 0, 40, 60, and 80 mg/ml depending on whether they were formed by introducing an NH4H2PO4 solution into a Ca(NO3)2 solution (P → Ca) or vice versa (Ca → P) (c). Data points represent averages (n = 3) and error bars represent the standard deviation. Data points statistically significantly different (p < 0.05) with respect to the comparative data point are marked with an asterisk.
F<sc>ig</sc>. 15.
Fig. 15.
Scheme describing key particle properties acting as determinants of the antibacterial activity of CP nanoparticles in interaction with bacterial cells, including (a) nanoscopic size; (b) release of calcium ions and elevation of the intracellular concentration of calcium; (c) diffusivity and low globally negative charge of a zwitterionic surface that minimizes the electrostatic barrier posed before the nanoparticle approaching the bacterial cell; and (d) Posner's and similarly sized atomic clusters creating a rich and dynamic hydrodynamic environment surrounding the diffusive nanoparticles, analogous to the tail of a comet, constantly dissipating and reintegrating with the particle surface, the drawing of the limits of which is challenging because of the complexity of this interface.

Similar articles

Cited by

References

    1. Wu V. M., Tang S., and Uskoković V., ACS Appl. Mater.Interfaces 10, 34013 (2018). 10.1021/acsami.8b12784 - DOI - PubMed
    1. Rochette C. N., Rosenfeldt S., Heiss A., Narayanan T., Ballauff M., and Jahnen-Dechent W., ChemBioChem 10, 735 (2009). 10.1002/cbic.200800719 - DOI - PubMed
    1. Pele L. C. et al., Nanomed. Nanotechnol. Biol. Med. 13, 619 (2017). 10.1016/j.nano.2016.07.008 - DOI - PubMed
    1. Powell J. J. et al., Nat. Nanotechnol. 10, 361 (2015). 10.1038/nnano.2015.19 - DOI - PMC - PubMed
    1. Llena C., Forner L., and Baca P., J. Contemp. Dent. Pract. 10, 1 (2009). - PubMed

Publication types

MeSH terms