. 2019 May 20;19(1):207.
doi: 10.1186/s12870-019-1815-x.

RNA-seq data reveals a coordinated regulation mechanism of multigenes involved in the high accumulation of palmitoleic acid and oil in sea buckthorn berry pulp

Affiliations

RNA-seq data reveals a coordinated regulation mechanism of multigenes involved in the high accumulation of palmitoleic acid and oil in sea buckthorn berry pulp

Jian Ding et al. BMC Plant Biol. .

Abstract

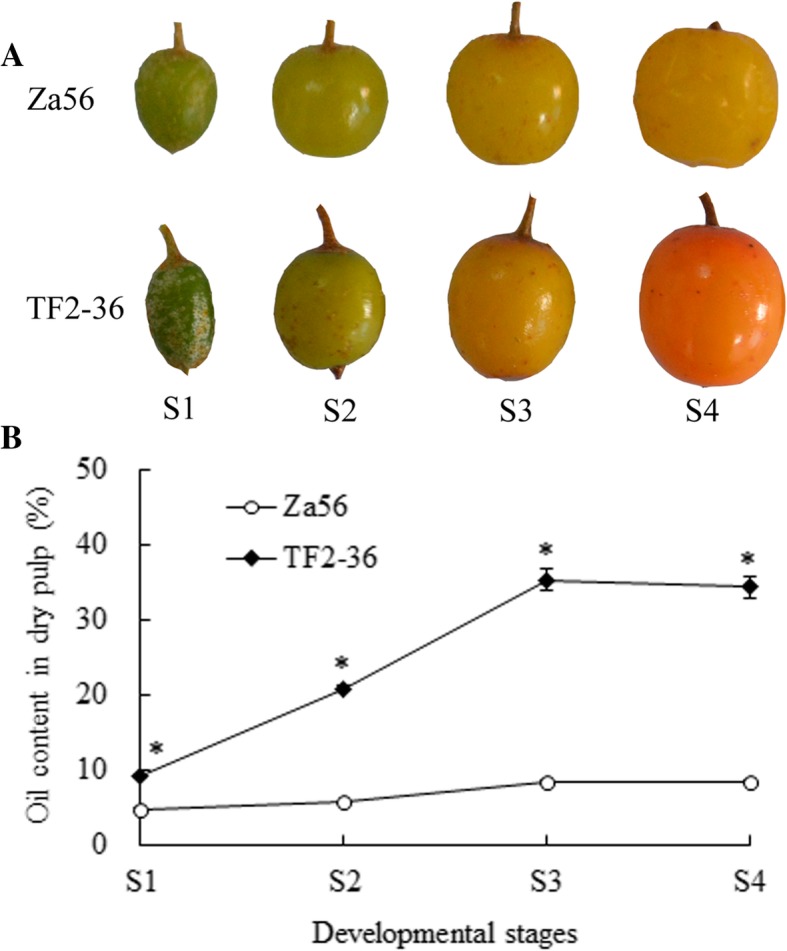
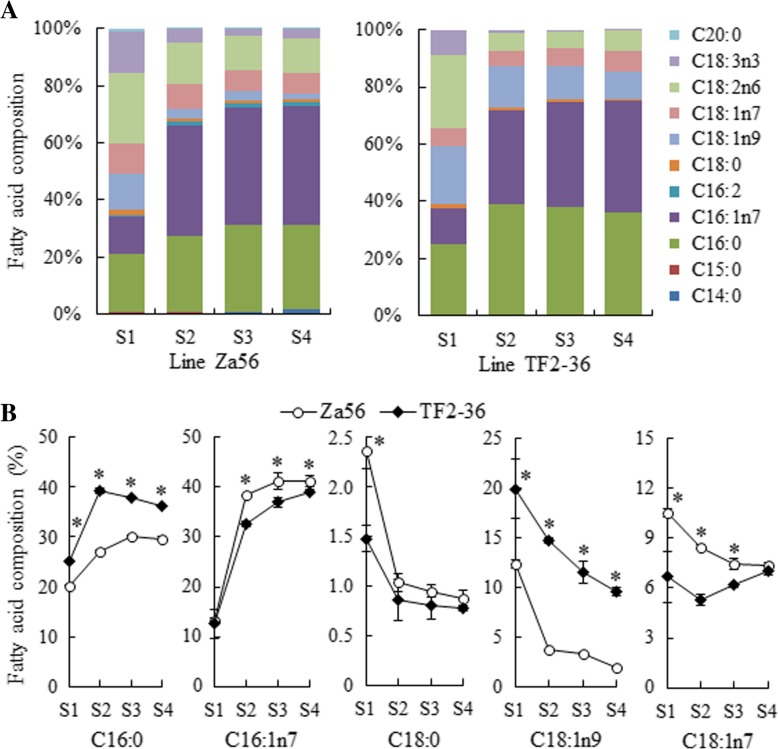
Background: Sea buckthorn is a woody oil crop in which palmitoleic acid (C16:1n7, an omega-7 fatty acid (FA)) contributes approximately 40% of the total FA content in berry pulp (non-seed tissue). However, the molecular mechanisms contributing to the high accumulation of C16:1n7 in developing sea buckthorn berry pulp (SBP) remain poorly understood.

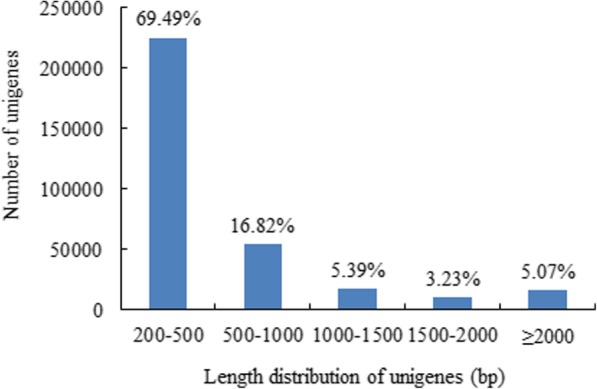
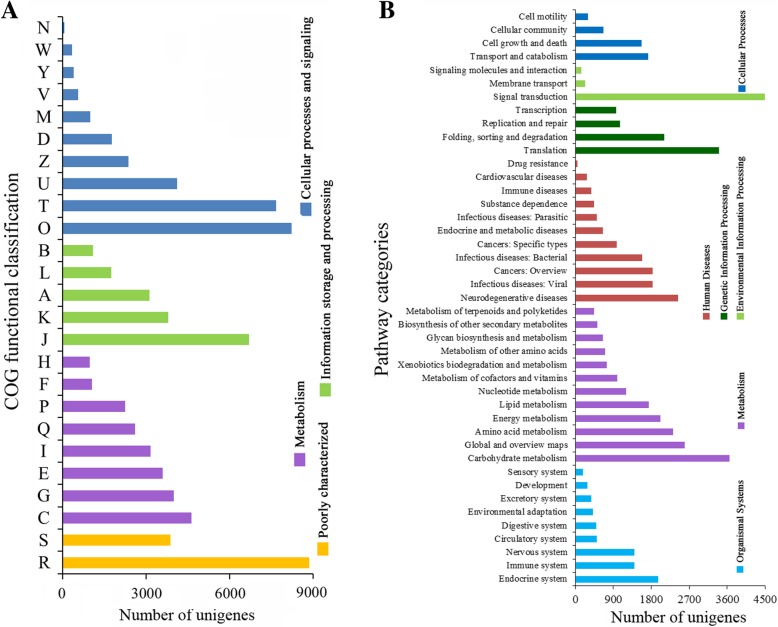
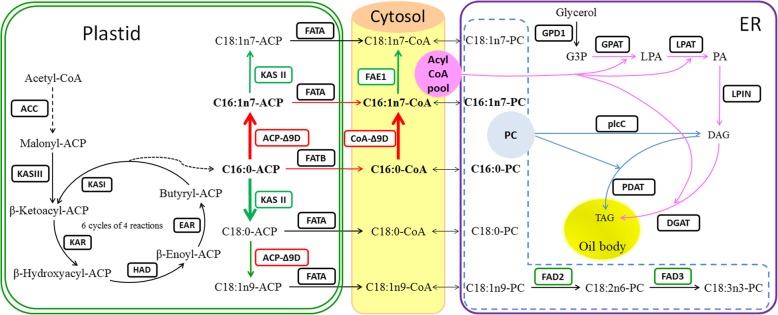
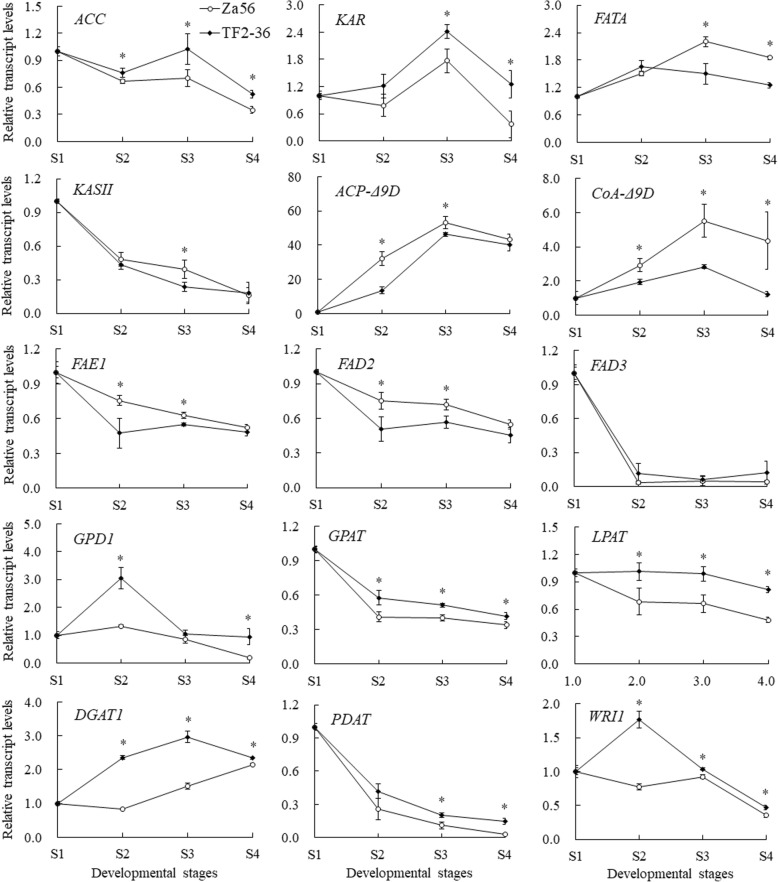
Results: We identified 1737 unigenes associated with lipid metabolism through RNA-sequencing analysis of the four developmental stages of berry pulp in two sea buckthorn lines, 'Za56' and 'TF2-36'; 139 differentially expressed genes were detected between the different berry pulp developmental stages in the two lines. Analyses of the FA composition showed that the C16:1n7 contents were significantly higher in line 'Za56' than in line 'TF2-36' in the mid-late developmental stages of SBP. Additionally, qRT-PCR analyses of 15 genes involved in FA and triacylglycerol (TAG) biosynthesis in both lines revealed that delta9-ACP-desaturase (ACP-Δ9D) competed with 3-ketoacyl-ACP-synthase II (KASII) for the substrate C16:0-ACP and that ACP-Δ9D and delta9-CoA-desaturase (CoA-Δ9D) gene expression positively correlated with C16:1n7 content; KASII and fatty acid elongation 1 (FAE1) gene expression positively correlated with C18:0 content in developing SBP. Specifically, the abundance of ACP-Δ9D and CoA-Δ9D transcripts in line 'Za56', which had a higher C16:1n7 content than line 'TF2-36', suggests that these two genes play an important role in C16:1n7 biosynthesis. Furthermore, the high expressions of the glycerol-3-phosphate dehydrogenase (GPD1) gene and the WRINKLED1 (WRI1) transcription factor contributed to increased biosynthesis of TAG precursor and FAs, respectively, in the early developmental stages of SBP, and the high expression of the diacylglycerol O-acyltransferase 1 (DGAT1) gene increased TAG assembly in the later developmental stages of SBP. Overall, we concluded that increased ACP-Δ9D and CoA-Δ9D levels coupled with decreased KASII and FAE1 activity is a critical event for high C16:1n7 accumulation and that the coordinated high expression of WRI1, GPD1, and DGAT1 genes resulted in high oil accumulation in SBP.

Conclusion: Our results provide a scientific basis for understanding the mechanism of high C16:1n7 accumulation in berry pulp (non-seed tissue) and are valuable to the genetic breeding programme for achieving a high quality and yield of SBP oil.

Keywords: Berry pulp oil; Fatty acid biosynthesis; Hippophae L.; Non-seed tissue; Oil accumulation; Palmitoleic acid.


Conflict of interest statement

The authors declare that they have no competing interests.

Figures

Fig. 1
Fig. 1
Phenotypic observations and oil content in the developing berry pulp of the two sea buckthorn lines ‘Za56’ and ‘TF2–36’. a The developmental progress of fruits from lines ‘Za56’ and ‘TF2–36’ (S1–S4). S1, S2, S3 and S4 indicate the developmental stage of berry pulp collected on July 6, July 28, August 19 and September 10, respectively. b Oil content was measured at four developmental stages during pulp development in lines ‘Za56’ and ‘TF2–36’. * indicate significant differences of data between the two lines at the same developmental stage at the level of 0.05
Fig. 2
Fig. 2
FA composition in SBP from lines ‘Za56’ and ‘TF2–36’ at four developmental stages. a Changes in the composition of various FAs in each line. b Comparison of five major FAs between two lines. The error bars indicate the standard deviations of three biological replicates. * indicate significant differences of FA composition between the two lines at the same developmental stages at the level of 0.05
Fig. 3
Fig. 3
Length distributions of assembled unigenes
Fig. 4
Fig. 4
Functional classifications and annotation of unigenes. a COG classification: A, RNA processing and modifications; B, Chromatin structure and dynamics; C, Energy production and conversion; D, Cell cycle control, cell division, chromosome partitioning; E, Amino acid transport and metabolism; F, Nucleotide transport and metabolism; G, Carbohydrate transport and metabolism; H, Coenzyme transport and metabolism; I, Lipid transport and metabolism; J, Translation, ribosomal structure and biogenesis; K, Transcription; L, Replication, recombination and repair; M, Cell wall/membrane/envelope biogenesis; N, Cell motility; O, Posttranslational modification, protein turnover, chaperones; P, Inorganic ion transport and metabolism; Q, Secondary metabolites biosynthesis, transport and catabolism; R, General function prediction only; S, Function unknown; T, Signal transduction mechanisms; U, Intracellular trafficking, secretion, and vesicular transport; V, Defence mechanisms; W, Extracellular structures; Y, Nuclear structure; Z, Cytoskeleton. b KEGG classifications
Fig. 5
Fig. 5
Numbers of upregulated and downregulated DEGs in the two sea buckthorn lines. a Numbers of DEGs in line ‘Za56’ by pairwise comparisons of four developmental stages. b Numbers of DEGs in line ‘TF2–36’ by pairwise comparisons of four developmental stages. c Numbers of DEGs between the two lines at the same developmental stage
Fig. 6
Fig. 6
Schematic diagram representing palmitoleic acid biosynthesis and TAG accumulation in SBP. The bold arrows in red indicate the metabolic flux from C16:0-ACP to C16:1n7-TAG. The red (upregulation) and green (downregulation) boxes indicate the key genes in C16:1 biosynthesis and its accumulation in TAG. The violet arrows indicate the Kennedy pathways in TAG assembly. The blue arrows indicate the phosphatidylcholine acyl pathways in TAG assembly. The enzymes are shown in boxes and abbreviated as follow: ACC, acetyl-CoA carboxylase; KAS, 3-ketoacyl-ACP synthase (KAS I, KAS II, KAS III); KAR, 3-ketoacyl-ACP reductase; HAD, β-hydroxyacyl-ACP dehydrase; EAR, enoyl-ACP reductase; FATA, acyl-ACP thioesterase A; FATB, acyl-ACP thioesterase B; Δ9D, delta-9 desaturase; FAE1, fatty acid elongation 1; FAD2, fatty acid desaturase 2; FAD3, fatty acid desaturase 3; GPD1, glycerol-3-phosphate dehydrogenase; GPAT, glycerol-3-phosphate O-acyltransferase; LPAT, lysophosphatidic acid acyltransferase; LPIN, phosphatidate phosphatase; DGAT, diacylglycerol O-acyltransferase; plcC, phospholipase C; PDAT, phopholipid:diacyglycerol acyltransferase. The names of key intermediates are abbreviated as follows: G3P, glycerol-3-phosphate; LPA, lysophosphatidic acid; PA, phosphatidic acid; DAG, diacylglycerol; TAG, triacylglycerol
Fig. 7
Fig. 7
Heat maps of unigenes involved in FA biosynthesis (a) and TAG accumulation (b) in SBP. The expression value (in FPKM) for the unigenes during berry pulp development in both lines was log2 transformed, and the total FPKM value was greater than 20
Fig. 8
Fig. 8
qRT-PCR analysis of genes involved in C16:1n7 biosynthesis and TAG accumulation in lines ‘Za56’ and ‘TF2–36’ at four different developmental stages

Similar articles

Cited by

References

    1. Ruan CJ, Rumpunen K, Nybom H. Advances in improvement of quality and resistance in a multipurpose crop: sea buckthorn. Crit Rev Biotechnol. 2013;33(2):126–144. - PubMed
    1. Ding J, Ruan CJ, Guan Y, Shan JY. Comparison of oil contents and fatty acid composition between developing sea buckthorn pulp and seed. China Oil and Fats. 2017;42(5):140–144.
    1. Yang B, Kallio H. Fatty acid composition of lipids in sea buckthorn (Hippophae rhamnoides L.) berries of different origins. J Agric Food Chem. 2001;49(4):1939–1947. - PubMed
    1. Fatima T, Snyder CL, Schroeder WR, Cram D, Datla R, Wishart D, et al. Fatty acid composition of developing sea buckthorn (Hippophae rhamnoides L.) berry and the transcriptome of the mature seed. PLoS One. 2012;7(4):e34099. - PMC - PubMed
    1. Li W, Ruan CJ, Teixeira da Silva JA, Guo H, Zhao CE. NMR metabolomics of berry quality in sea buckthorn (Hippophae L.) Mol Breeding. 2013;31(1):57–67.