

High NCALD expression predicts poor prognosis of cytogenetic normal acute myeloid leukemia
- PMID: 31109331
- PMCID: PMC6528257
- DOI: 10.1186/s12967-019-1904-5
High NCALD expression predicts poor prognosis of cytogenetic normal acute myeloid leukemia
Abstract
Background: Acute myeloid leukemia (AML) is a heterogeneous disease in terms of genetic basis, clinical, biological and prognostic, and is a malignant clonal disease of leukemia stem cells (LSCs). Nearly half of adult AML patients exhibit a cytogenetic normal acute myeloid leukemia (CN-AML). The expression level of NCALD gene was associated with the prognosis of ovarian cancer and non-small cell lung cancer (NSCLC). The expression level of NCALD gene is still unclear in the prognosis of patients with AML.
Method: We integrated 5 independent datasets totally 665 AML patients (497 CN-AML patients) to analyzed relation between NCALD gene expression and the clinical FAB classification, gene mutation, therapy, prognosis of CN-AML. We analyzed the NCALD gene expression with the prognosis and LSC of 165 AML patients from The Cancer Genome Atlas (TCGA) dataset and 78 AML patients from GEO dataset.
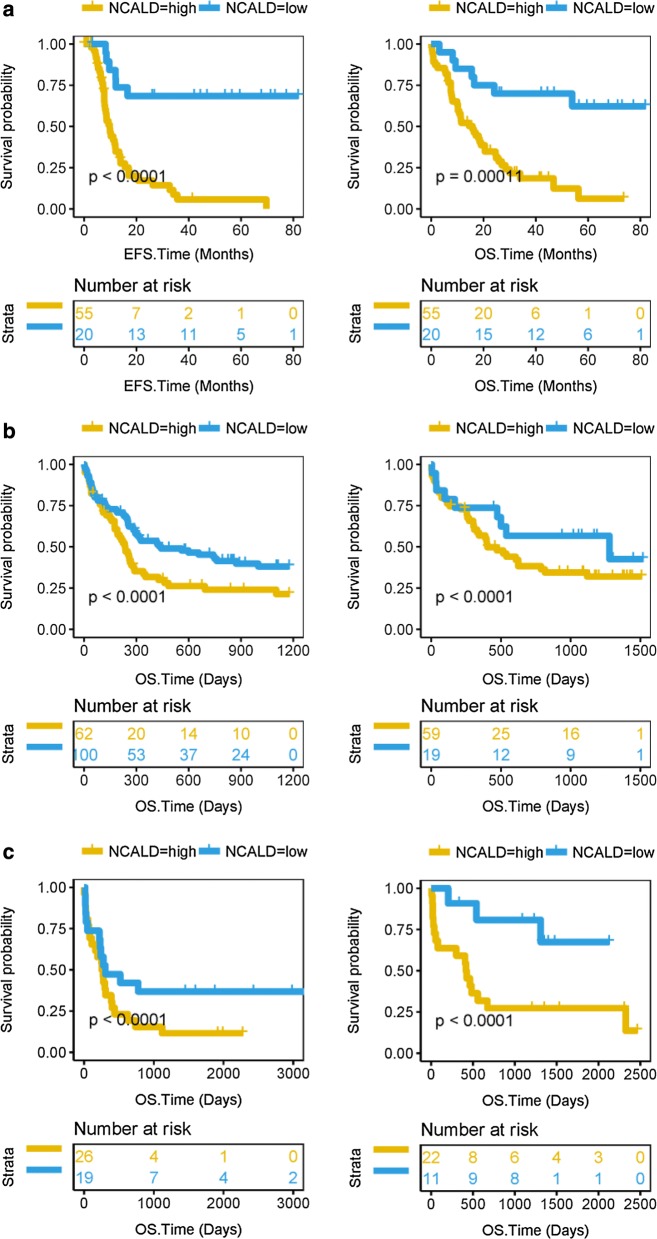
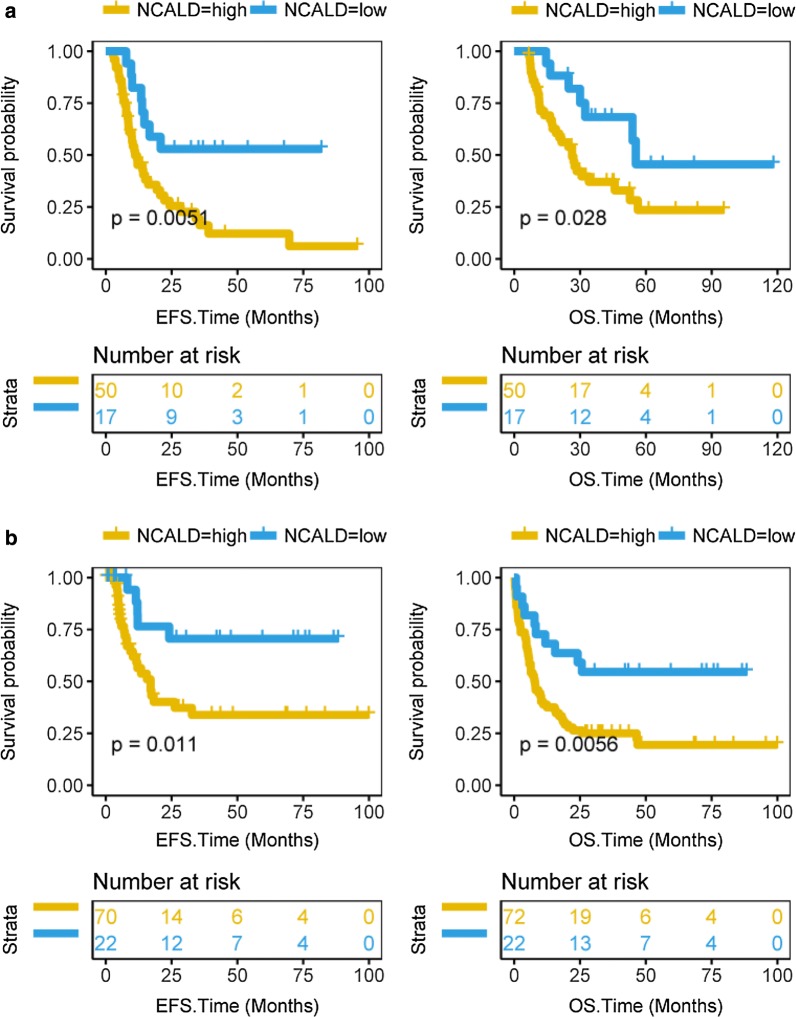
Results: High NCALD-expressing CN-AML patients were associated with poor event-free survival (EFS) and overall survival (OS) compared to low NCALD expression (EFS, P < 0.0001, OS, P < 0.0001). In AML patients of allogeneic hematopoietic stem cell transplantation (allo-HSCT), high NCALD expression was associated with poor survival prognosis in EFS and OS (EFS, P < 0.0051, OS, P = 0.028). Post-chemotherapy in AML patients, high NCALD expression led a worse prognosis in EFS and OS (EFS, P = 0.011; OS, P = 0.0056). In multivariate analysis, high NCALD expression was an independent prognostic factor that predicts shorter EFS and OS (EFS, P = 3.84E-05, OS, P = 8.53E-05) of CN-AML.
Conclusion: Our results indicate that high expression of NCALD gene is a poor prognostic factor for CN-AML. NCALD can be considered as independent predictors of CN-AML patients and can be used as a biomarker for the prognosis of CN-AML.
Keywords: Cytogenetic normal acute myeloid leukemia (CN-AML); LSC; NCALD; Prognostic factor.
Conflict of interest statement
The authors declare that they have no competing interests.
Figures
References
-
- Frohling S, Schlenk RF, Kayser S, Morhardt M, Benner A, Dohner K, et al. Cytogenetics and age are major determinants of outcome in intensively treated acute myeloid leukemia patients older than 60 years: results from AMLSG trial AML HD98-B. Blood. 2006;108(10):3280–3288. doi: 10.1182/blood-2006-04-014324. - DOI - PubMed
-
- Slovak ML, Kopecky KJ, Cassileth PA, Harrington DH, Theil KS, Mohamed A, et al. Karyotypic analysis predicts outcome of preremission and postremission therapy in adult acute myeloid leukemia: a Southwest Oncology Group/Eastern Cooperative Oncology Group Study. Blood. 2000;96(13):4075–4083. - PubMed
Publication types
MeSH terms
Substances
LinkOut - more resources
Full Text Sources
Medical
