. 2019 May 20;10(1):136.
doi: 10.1186/s13287-019-1242-9.

R-spondin2 promotes hematopoietic differentiation of human pluripotent stem cells by activating TGF beta signaling

Affiliations

R-spondin2 promotes hematopoietic differentiation of human pluripotent stem cells by activating TGF beta signaling

Yv Wang et al. Stem Cell Res Ther. .

Abstract

Background: Human pluripotent stem cells (hPSCs) provide supplies of potential functional blood cells to suffice the clinical needs. However, the underlying mechanism of generating genuine hematopoietic stem cells (HSCs) and functional blood cells from hPSCs remains largely elusive.

Method: In this study, we supplied R-spondin2 exogenously during hematopoietic differentiation of hPSCs under various culture conditions and analyzed the production of hematopoietic progenitor cells (HPCs). We further added R-spondin2 at different temporal window to pin down the stage at which R-spondin2 conferred its effects. RNA-SEQ-based gene profiling was applied to analyze genes with significantly altered expression and altered signaling pathways. Finally, megakaryocytic differentiation and platelet generation were determined using HPCs with R-spondin2 treatment.

Results: We found that R-spondin2 generated by hematopoiesis-supporting stromal cells significantly enhances hematopoietic differentiation of hPSCs. Supply of R-spondin2 exogenously at the early stage of mesoderm differentiation elevates the generation of APLNR+ cells. Furthermore, early treatment of cells with R-spondin2 enables us to increase the output of hPSC-derived platelet-like particles (PLPs) with intact function. At the mechanistic level, R-spondin2 activates TGF-β signaling to promote the hematopoietic differentiation.

Conclusions: Our results demonstrate that a transient supply of R-spondin2 can efficiently promote hematopoietic development by activating both WNT and TGF-β signaling. R-spondin2 can be therefore used as a powerful tool for large-scale generation of functional hematopoietic progenitors and platelets for translational medicine.

Keywords: Hematopoietic differentiation; Human pluripotent stem cells; Mesoderm; R-spondin2; TGF-β signaling.


Conflict of interest statement

The authors declare that they have no competing interests.

Figures

Fig. 1
Fig. 1
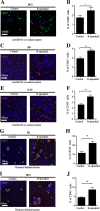
R-spondin2 promotes generation of hematopoietic progenitors from hESCs. a Left panel: heatmap of Rspo expression in OP9-d4, OP9-d8, and MS5 stromal cells (accession number GEO: GSE61580). Right panel: heatmap of Rspo expression in AGM-S3-A7, AGM-S3-A9 subclones of AGM-S3 stromal cell and OP9 cells (accession number GEO: GSE11891). b Real-time PCR analysis of expression of Rspos in mAGM-S3 stromal cells. Relative expression is normalized to the level (= 1) of Actin. Results are shown as means ± SD (n = 3). c Representative immunofluorescence images of H1 cells with or without treatment of R-spondin2 (20 ng/mL) showing the generation of CD43+ HPCs at day 7 of mAGM-S3 co-culture. d Flow cytometry analysis of H1 cells with or without treatment of R-spondin2 (20 ng/mL) showing the generation of CD43+ HPCs at day 7 of mAGM-S3 co-culture. Results are shown as means ± SD (n = 3). ***P < 0.001. e Representative immunofluorescence images of H1 cells with or without the treatment of R-spondin2 (20 ng/mL) showing the generation of CD45+ HPCs at day 10 of mAGM-S3 co-culture. f Flow cytometry analysis of H1 cells with or without the treatment of R-spondin2 (20 ng/mL) showing the generation of CD45+ HPCs at day 10 of mAGM-S3 co-culture. Results are shown as means ± SD (n = 3). **P < 0.01. g Hematopoietic colony-forming potential of hESC-derived cells after 12 days of co-culture with or without the treatment of R-spondin2 (20 ng/mL), analyzed using total colony numbers (upper panel) and the proportion of BFU-E (burst-forming unit-erythroid), CFU-E (colony forming unit-erythrocyte), CFU-GM (colony forming unit-granulocyte/macrophage) and CFU-GEMM (colony-forming unit-granulocyte/erythroid/macrophage/monocyte) (lower panel). Results are shown as means ± SD (n = 3). NS, not significant, *P < 0.05. GEMM, P = 0.56; GM, P = 0.32; CFU-E, P = 0.65; BFU-E, P = 0.64
Fig. 2
Fig. 2
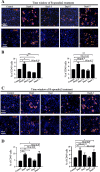
R-spondin2 enhances hematopoietic differentiation of hPSCs independently of culture conditions and cell lines. a Representative immunofluorescence images of BC1 cells with or without treatment of R-spondin2 (20 ng/mL) showing the generation of CD43+ HPCs at day 7 of mAGM-S3 co-culture. b Flow cytometry analysis of BC1 cells with or without treatment of R-spondin2 (20 ng/mL) showing the generation of CD43+ HPCs at day7 of mAGM-S3 co-culture. Results are shown as means ± SD (n = 3). *P < 0.05. c Representative immunofluorescence images of H9 cells with or without treatment of R-spondin2 (20 ng/mL) showing the generation of CD43+ HPCs at day7 of mAGM-S3 co-culture. d Flow cytometry analysis of H9 cells with or without treatment of R-spondin2 (20 ng/mL) showing the generation of CD43+ HPCs at day7 of mAGM-S3 co-culture. Results are shown as means ± SD (n = 3). **P < 0.01. e Representative immunofluorescence images of Z-15 cells with or without treatment of R-spondin2 (20 ng/mL) showing the generation of CD43+ HPCs at day7 of mAGM-S3 co-culture. f Flow cytometry analysis of Z-15 cells with or without treatment of R-spondin2 (20 ng/mL) showing the generation of CD43+ HPCs at day7 of mAGM-S3 co-culture. Results are shown as means ± SD (n = 3). **P < 0.01. g Representative immunofluorescence images of H1 cells with or without treatment of R-spondin2 (20 ng/mL) showing the generation of CD43+ HPCs at day 7 of chemical defined hematopoietic differentiation. h Flow cytometry analysis of H1 cells with or without treatment of R-spondin2 (20 ng/mL) showing the generation of CD43+ HPCs at day7 of chemical defined hematopoietic differentiation. Results are shown as means ± SD (n = 3). **P < 0.01. i Representative immunofluorescence images of BC1 cells with or without treatment of R-spondin2 (20 ng/mL) showing the generation of CD43+ HPCs at day 7 of chemically defined hematopoietic differentiation condition. j Flow cytometry analysis of BC1 cells with or without treatment of R-spondin2 (20 ng/mL) showing the generation of CD43+ HPCs at day 7 of chemically defined hematopoietic differentiation condition. Results are shown as means ± SD (n = 3). **P < 0.01
Fig. 3
Fig. 3
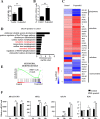
R-spondin2 treatment during early mesoderm differentiation suffices to promote hPSC hematopoietic differentiation. a Representative immunofluorescence images of H1 cells with treatment of R-spondin2 (20 ng/mL) at different stages of differentiation showing the generation of CD43+ HPCs at day 7 (top) and CD45+ HPCs at day 10 (bottom) of mAGM-S3 co-culture differentiation. b Flow cytometry analysis of the percentage of CD43+ HPCs at day 7 (left) and CD45+ HPCs at day 10 (right) from H1 cells in mAGM-S3 co-culture differentiation with R-spondin2 treatment (20 ng/mL) at different stages of differentiation. Day0–3: R-spondin2 was added from day 0 to day 3 and withdrawn at other days. Day3–5: R-spondin2 was added from day 3 to day 5 and withdrawn at other days. Day5–7: R-spondin2 was added from day 5 to day 7 and withdrawn at other days. Day0–7: R-spondin2 was added from day 0 to day 7 throughout. Results are shown as means ± D (n = 3). NS, not significant, *P < 0.05, ***P < 0.001. c Representative immunofluorescence images of H1 cells with the treatment of R-spondin2 (20 ng/mL) at different temporal window of mesoderm induction showing the generation of CD43+ HPCs at day 7 (top) and CD45+ HPCs at day 10 (bottom) of mAGM-S3 co-culture differentiation. d Flow cytometry analysis of the percentage of CD43+ HPCs at day 7 (left) and CD45+ HPCs at day 10 (right) from H1 cells in mAGM-S3 co-culture differentiation with R-spondin2 treatment (20 ng/mL) at different temporal window of mesoderm induction. Day0: R-spondin2 was added at day 0 for 24 h and withdrawn at other days. Day1: R-spondin2 was added at day 1 for 24 h and withdrawn at other times. Day2: R-spondin2 was added at day 2 for 24 h and withdrawn at other times. Day0–3: R-spondin2 was added from day 0 to day 3 and withdrawn at other times. Results are shown as means ± SD (n = 3). NS, not significant, *P < 0.05, **P < 0.01
Fig. 4
Fig. 4
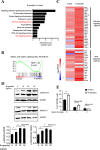
R-spondin2 promotes hematopoietic differentiation by augmenting APLNR+ mesodermal cells. a, b Flow cytometry analysis of the percentage of APLNR+ mesoderm cells (a) at day 3 and CD31+CD34+ HEPs (b) at day 5 of differentiation in mAGM-S3 co-culture from H1 cells with or without the treatment of R-spondin2 (20 ng/mL). Results are shown as means ± SD (n = 3). **P < 0.01. c Heatmap showing expression change of genes associated with pluripotency and three germ layers after R-spondin2 treatment (log10FPKM). d Top 10 biological functions of upregulated genes after R-spondin2 treatment using GO analysis. e GSEA comparison showing upregulation of mesoderm-associated genes with R-spondin2 treatment. f The kinetics of expression of representative mesoderm genes BRACHYURY, MIXL1, APLNR, and KDR during early hematopoietic differentiation from hESCs in chemically defined condition with or without treatment of R-spondin2 (20 ng/mL) analyzed with real-time PCR. Relative expression is normalized to the level (= 1) of control at day 0. Results are shown as means ± SD (n = 3). Results are shown as means ± SD (n = 3). *P < 0.05, ***P < 0.001
Fig. 5
Fig. 5
Activation of TGFβ signaling by R-spondin2. a KEGG pathway analysis of upregulated pathways in R-spondin2-treated cells versus control. b GSEA showing enrichment of TGFβ-associated genes with R-spondin2 treatment. c Heatmap showing genes with altered expression associated with TGFβ and WNT signaling after R-spondin2 treatment (log10FPKM). d Upper panel: Western blot analysis of phosphorylated SMAD2/3 and total SMAD2/3 protein levels in H1 cells at day 2 of differentiation in chemically defined medium treated with different doses of R-spondin2. 0, 10, 20, or 50 ng/mL of R-spondin2 was added at day 0 of hematopoietic differentiation. Lower panel: Densitometric quantitation of Western blot results of phosphorylated SMAD2/3 expression relative to GAPDH and total SMAD2/3 respectively. Results are shown as means ± SD (n = 3). NS, not significant. *P < 0.05. **P < 0.01. (E) Flow cytometry analysis of the percentage of APLNR+ cells from control and R-spondin2-treated H1 cells at day 3 of mAGM-S3 co-culture with different doses of SB-431542. R-spondin2 (20 ng/mL) was added along with 0, 1, or 2uM SB-431542 at day 0 of hematopoietic differentiation. Results are shown as means ± SD (n = 3). NS, not significant, **P < 0.01
Fig. 6
Fig. 6
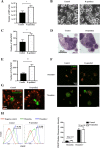
R-spondin2 ultimately augments the production of functional platelets from hPSCs. a Comparative analysis of the number of cobblestone-like HPCs after mechanical detachment from individual culture dishes of mAGM-S3 co-culture with or without R-spondin2 (20 ng/mL) treatment at day 1. Results are shown as means ± SD (n = 3). *P < 0.05. b Representative morphologies of large cells and proplatelets at day 6 of MK culture. c Quantitative analysis of CD41a+CD42b+ MKs generated from each H1 cells. Results are shown as means ± SD (n = 3). *P < 0.05. d Representative morphologies of multinuclear MKs by MGG (May-Grunwald-Giemsa) Staining at day 3 of megakaryocytic differentiation (scale bar, 20 mm). e Quantitative analysis of CD41a+CD42b+ PLPs generated from each H1 cells. Results are shown as means ± SD (n = 3). **P < 0.01. f Representative immunofluorescence images of hPSC-derived PLPs bound to immobilized fibrinogen with F-actin and CD41 stained in the absence (top) or the presence (bottom) of 1 U/mL thrombin. Scale bar = 5 μm. g Representative immunofluorescence images showing aggregation in a mixture of 2 × 105 Calcein-AM (red)-labeled hPSC-derived PLPs and 2 × 107 blood platelets. Scale bar = 5 μm. h Left panel: representative flow cytometry analysis of P-selectin (CD62P) in gated CD41a+ PLPs. Right panel: median fluorescence intensity analysis of CD62P in gated CD41a+ PLPs. Results are shown as means ± SD (n = 3). NS, not significant

Similar articles

Cited by

References

    1. Vo LT, Daley GQ. De novo generation of HSCs from somatic and pluripotent stem cell sources. Blood. 2015;125(17):2641–2648. doi: 10.1182/blood-2014-10-570234. - DOI - PMC - PubMed
    1. Easterbrook J, Fidanza A, Forrester LM. Concise review: programming human pluripotent stem cells into blood. Br J Haematol. 2016;173(5):671–679. doi: 10.1111/bjh.14010. - DOI - PMC - PubMed
    1. Sugimoto N, Eto K. Platelet production from induced pluripotent stem cells. J Thromb Haemost. 2017;15(9):1717–1727. doi: 10.1111/jth.13736. - DOI - PubMed
    1. Sun YQ, Chang YJ, Huang XJ. Update on current research into haploidentical hematopoietic stem cell transplantation. Expert Rev Hematol. 2018;11(4):273–284. doi: 10.1080/17474086.2018.1447379. - DOI - PubMed
    1. Liu S, Xu Y, Zhou Z, et al. Progress and challenges in generating functional hematopoietic stem/progenitor cells from human pluripotent stem cells. Cytotherapy. 2015;17(4):344–358. doi: 10.1016/j.jcyt.2015.01.003. - DOI - PubMed

Publication types

MeSH terms

Substances