. 2019 May 20;7(1):81.
doi: 10.1186/s40478-019-0703-9.

Replication of multiple system atrophy prions in primary astrocyte cultures from transgenic mice expressing human α-synuclein

Affiliations

Replication of multiple system atrophy prions in primary astrocyte cultures from transgenic mice expressing human α-synuclein

Zuzana Krejciova et al. Acta Neuropathol Commun. .

Abstract

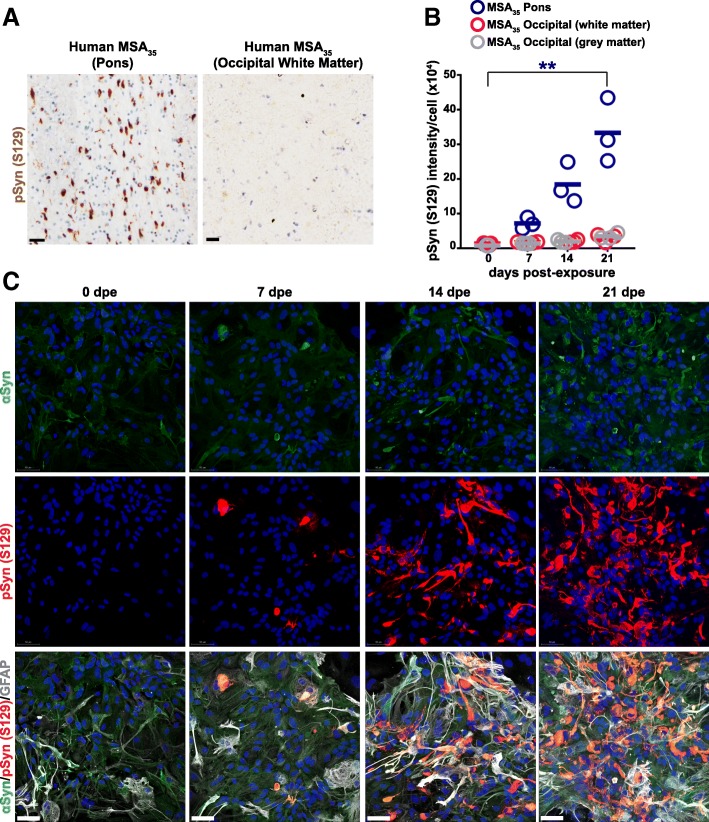
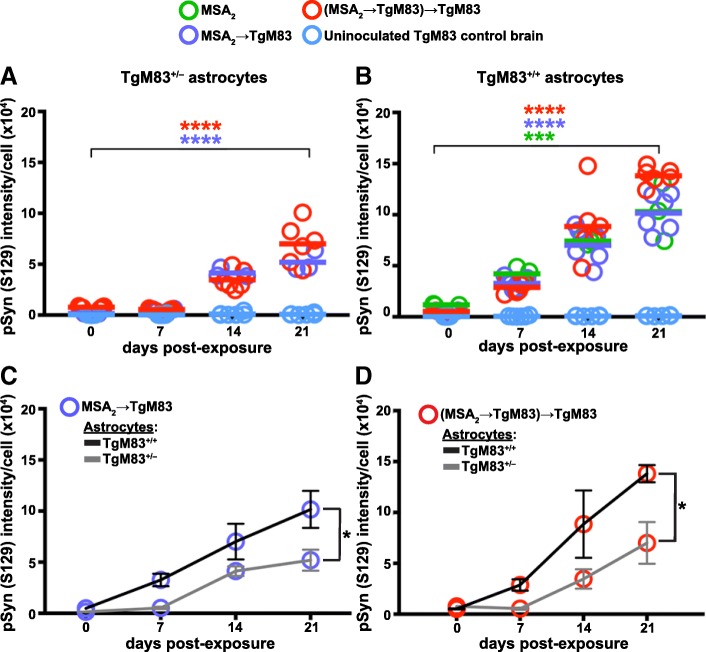
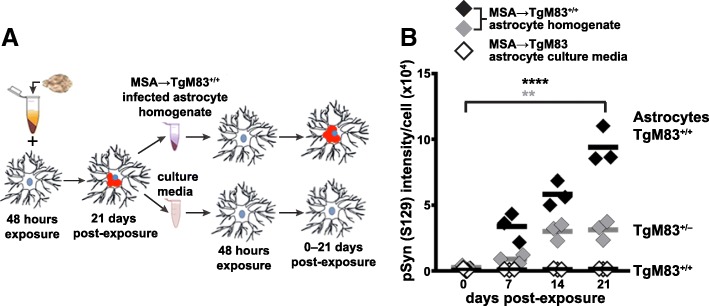
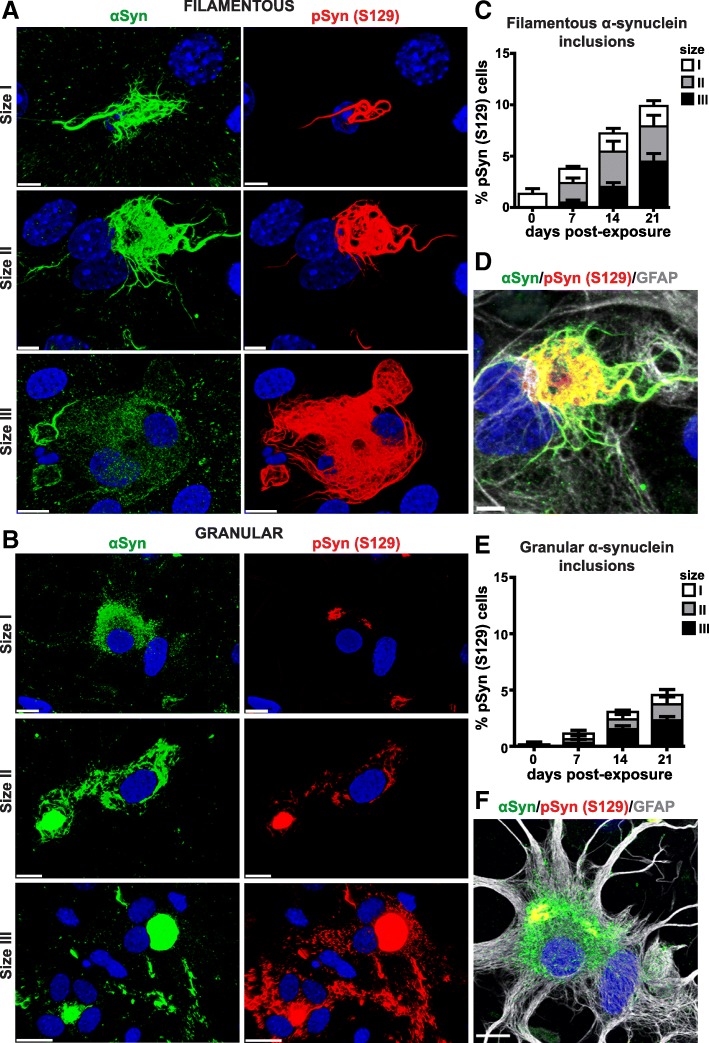
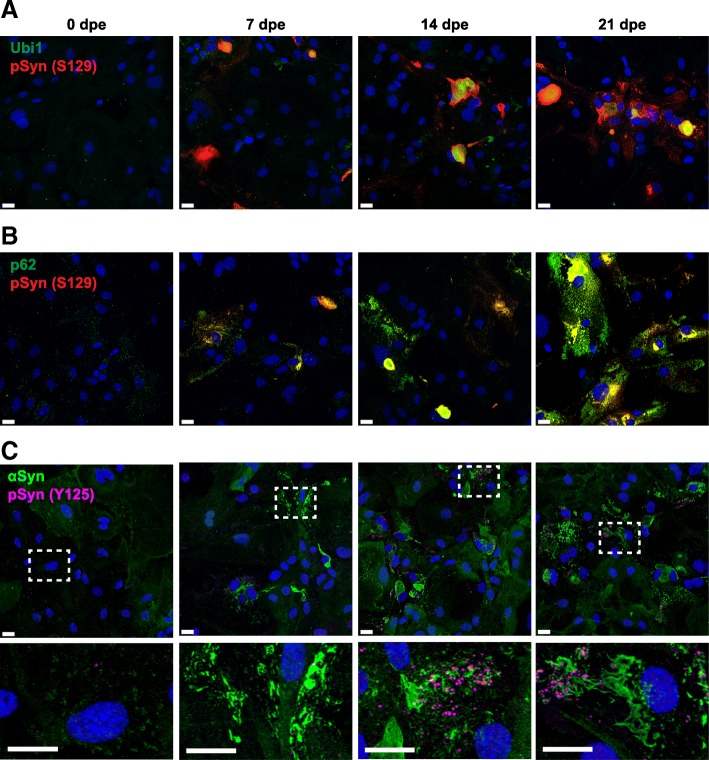
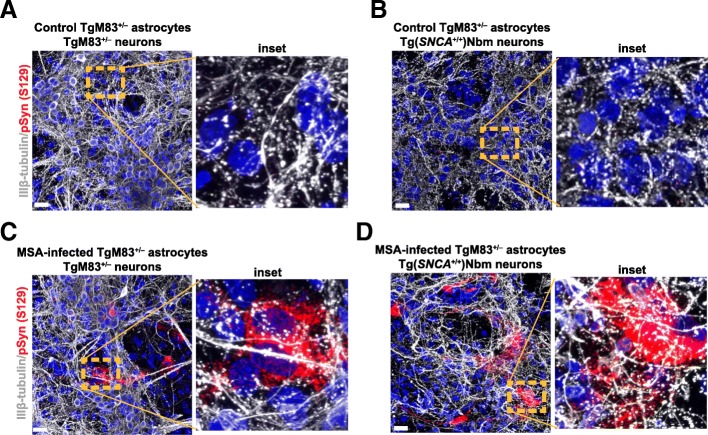
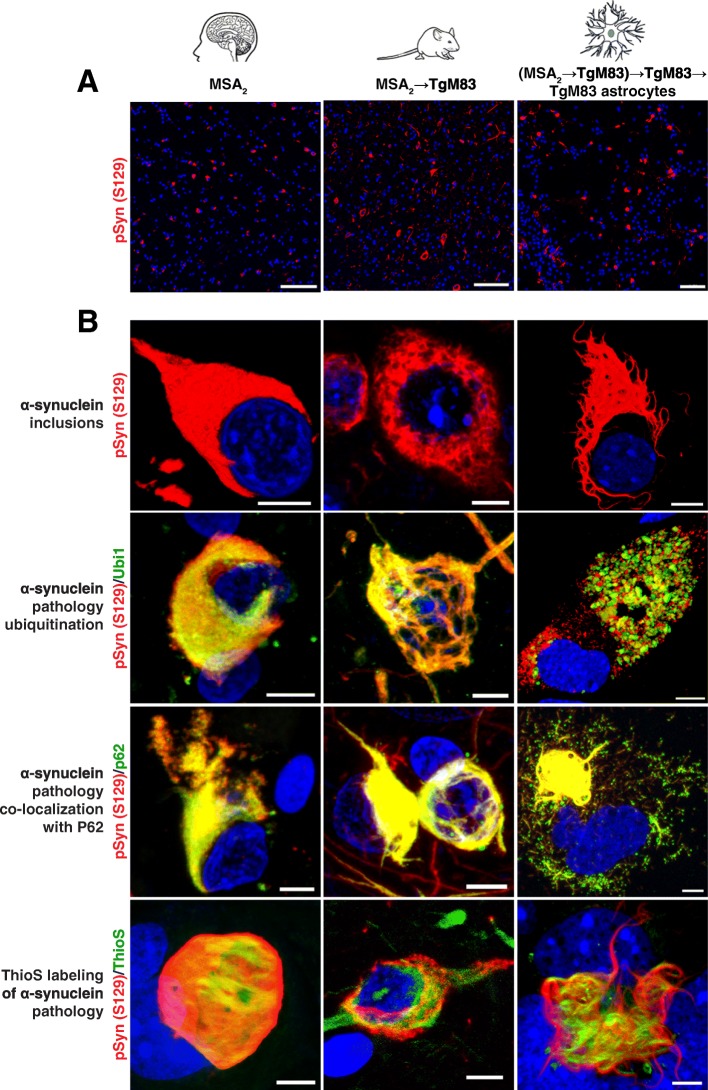
Glial cytoplasmic inclusions (GCIs) containing aggregated and hyperphosphorylated α-synuclein are the signature neuropathological hallmark of multiple system atrophy (MSA). Native α-synuclein can adopt a prion conformation that self-propagates and spreads throughout the brain ultimately resulting in neurodegeneration. A growing body of evidence argues that, in addition to oligodendrocytes, astrocytes contain α-synuclein inclusions in MSA and other α-synucleinopathies at advanced stages of disease. To study the role of astrocytes in MSA, we added MSA brain homogenate to primary cultures of astrocytes from transgenic (Tg) mouse lines expressing human α-synuclein. Astrocytes from four Tg lines, expressing either wild-type or mutant (A53T or A30P) human α-synuclein, propagated and accumulated α-synuclein prions. Furthermore, we found that MSA-infected astrocytes formed two morphologically distinct α-synuclein inclusions: filamentous and granular. Both types of cytoplasmic inclusions shared several features characteristic of α-synuclein inclusions in synucleinopathies: hyperphosphorylation preceded by aggregation, ubiquitination, thioflavin S-positivity, and co-localization with p62. Our findings demonstrate that human α-synuclein forms distinct inclusion morphologies and propagates within cultured Tg astrocytes exposed to MSA prions, indicating that α-synuclein expression determines the tropism of inclusion formation in certain cells. Thus, our work may prove useful in elucidating the role of astrocytes in the pathogenic mechanisms that feature in neurodegeneration caused by MSA prions.

Keywords: Astrocytes; MSA; Prion; Proteinopathies; α-Synuclein.


Conflict of interest statement

The Institute for Neurodegenerative Diseases has a research collaboration with Daiichi Sankyo (Tokyo, Japan). S.B.P. is a member of the Scientific Advisory Board of ViewPoint Therapeutics, which has not contributed financial or any other support to these studies.

Figures

Fig. 1
Fig. 1
α-Synuclein accumulation and phosphorylation at serine 129 in primary astrocytes exposed to human MSA brain homogenate. a Representative images of immunohistochemical detection of α-synuclein deposits in a patient sample, MSA35. Brain tissue from pons (left) and occipital cortex (right). Tissues were immunostained for phosphorylated α-synuclein at serine 129 [pSyn (S129), brown], and nuclei are in blue. Scale bars, 100 μm. b Quantification of pSyn (S129) signal intensity in TgM83+/+ astrocytes exposed to MSA35 brain tissue from pons (dark blue circles), occipital cortex (white matter; pink circles), and occipital cortex (grey matter; grey circles). Only tissue from the midbrain (pons) region induced rapid accumulation of pSyn (S129) over time. The signal intensity was normalized by cell count. Data are plotted with mean (n = 3) and analyzed using an unpaired t-test. c Representative immunographs of primary TgM83+/+ astrocytes exposed to 0.5% MSA35 brain homogenate (pons) for 48 h and further cultured in fresh media up to 21 days post-exposure (dpe). Cells were immunostained for total human α-synuclein (αSyn, green), pSyn (S129) (red), and glial fibrillary acidic protein (GFAP, white). Merge of all three channels is shown in the bottom row. Nuclei were stained with DAPI (blue). Scale bars, 50 μm
Fig. 2
Fig. 2
α-Synuclein aggregation and inclusion formation in MSA-exposed TgM83 astrocytes is rapid, gene-dose-, and time-dependent. Quantification of a TgM83+/− and b TgM83+/+ astrocyte cultures exposed to 0.5% brain homogenates from MSA2 (green circles, n = 3), primary passaged MSA2 in TgM83+/− mice (purple circles, n = 3 TgM83+/− astrocytes; n = 6 TgM83+/+ astrocytes), secondary passaged MSA2 in TgM83+/− mice (red circles, n = 6), and age-matched control TgM83+/+ littermates (blue circles, n = 5). Cultures were analyzed at 0, 7, 14, and 21 days post-exposure (dpe). Astrocytes were immunostained for phosphorylated α-synuclein (S129), and the signal intensity was normalized by cell count. We observed a rapid, gene-dose-, and time-dependent accumulation of phosphorylated α-synuclein in astrocytes exposed to MSA prions. Data are plotted with mean and analyzed by one-way ANOVA followed by Tukey’s multicolumn comparison test: ****, P < 0.0001; ***, P = 0.0003. c, d Gene-dose dependency was analyzed by plotting data from (a, b) where TgM83+/+ (black line) and TgM83+/− (grey line) astrocyte cultures were exposed to (c) primary passaged MSA2 (purple circles). Linear regression was applied to each group (TgM83+/+, P = 0.0015; TgM83+/−, P = 0.0496) followed by ANCOVA analysis of covariance to compare the slopes: *, P = 0.0334; F = 10.13; DFn = 1; DFd = 4. d The same Tg mouse lines were exposed to secondary passaged MSA2 (red circles). Linear regression was applied to each group (TgM83+/+, P = 0.0130; TgM83+/−, P = 0.0736) followed by ANCOVA analysis of covariance to compare the slopes: *, P = 0.0411; F = 8.82; DFn = 1; DFd = 4
Fig. 3
Fig. 3
Subpassage of MSA prions in TgM83 cultured astrocytes. a Schematic representation of cell homogenate preparation and media collection from MSA-infected TgM83+/+ astrocyte cultures at 21 dpe. Naïve astrocytes were then exposed to the cell homogenate or medium for 48 h, cultured up to 21 days, and analyzed for pSyn (S129) at four time points. b Quantification of TgM83+/+ (black diamonds) and TgM83+/− (grey diamonds) astrocytes exposed to MSA-infected cell homogenate and TgM83+/+ astrocytes cultured with media previously cultured with MSA-infected astrocytes (white diamonds). Astrocytes were immunolabeled for pSyn (S129), and the signal intensity was normalized by cell count. Data are plotted with mean and analyzed by one-way ANOVA followed by Tukey’s multicolumn comparison test: ****, P < 0.0001; **, P = 0.0017
Fig. 4
Fig. 4
Filamentous and granular α-synuclein inclusions form in MSA-infected cultured TgM83 astrocytes. 3D volume visualization of maximum intensity projection of Z-stacks of α-synuclein inclusions in MSA-infected TgM83+/+ astrocytes aggregating as a filamentous and b granular α-synuclein inclusions. c, e Quantification of pSyn (S129) inclusions formed in MSA-infected TgM83+/+ cultures [size I (< 10 μm), size II (10–50 μm), and size III (> 50 μm)] at 0, 7, 14, and 21 days post-exposure (dpe). Cell count of each group is represented as percentage of total cells, and the data were acquired from 16 randomized fields from four replicate experiments (n = 4). Astrocytes were immunostained for total human α-synuclein (αSyn, green), phosphorylated α-synuclein [pSyn (S129), red], and GFAP (white). d, f Maximum projection intensity of Z-stack and merge of all three channels is shown. Co-localization of pSyn (S129) and αSyn appears yellow. Nuclei were stained with DAPI (blue). Scale bars, a, b 20 μm, d 5 μm, f 10 μm
Fig. 5
Fig. 5
α-Synuclein inclusions in MSA-infected astrocytes are ubiquitinated and co-localized with p62 or contain α-synuclein phosphorylated at Y125. Representative immunographs of TgM83+/+ primary astrocytes exposed to 0.5% secondary passaged MSA2 brain homogenate for 48 h and immunostained at 0, 7, 14, and 21 days post-exposure (dpe) for a ubiquitin (green) and pSyn (S129) (red), b p62 (green) and pSyn (S129) (red), and c αSyn (green) and pSyn Y125 (magenta). Merge channels are shown, and c insets of dashed areas are shown in the bottom row. Nuclei were stained with DAPI (blue). Scale bars, 20 μm
Fig. 6
Fig. 6
Differing intensity of MSA prion infection in astrocytes expressing wt and human mutant α-synuclein (A53T). a Quantification of signal intensity of aggregated α-synuclein inclusions [pSyn (S129)] in Tg(SNCA+/+)Nbm (light blue line), TgM83+/+ (black line), and Tg(SNCA*A53T)Nbm (magenta line) astrocytes exposed to 0.5% MSA35 brain homogenate (pons, dark blue circles). Data are plotted with mean and analyzed by one-way ANOVA followed by Tukey’s multicolumn comparison test: ****, P < 0.0001; **, P = 0.0076. b Quantification of pSyn (S129) inclusions formed in MSA-infected Tg(SNCA+/+)Nbm cultures [size I (< 10 μm), size II (10–50 μm), and size III (> 50 μm)] at 0, 7, 14, and 21 days post-exposure (dpe). Cell count of each group is represented as percentage of total cells, and the data were acquired from 16 randomized fields from two replicate experiments (n = 2). c Graphic representation of same lines of Tg astrocytes as in (b) exposed to 0.5, 0.25, 0.125, and 0.0625% TgM83-passaged MSA and 0.5% TgM83+/+ control littermate brain homogenate. b, c Cultures were immunostained for pSyn (S129) at 0, 7, 14, and 21 dpe, and the signal intensity was normalized by cell count. Data are plotted with mean b (n = 3–6) and c (n = 1). d Representative immunographs of primary astrocytes from (b, c) immunostained for human αSyn (green) and pSyn (S129) (red). Merged channels are shown. Nuclei were stained with DAPI (blue). Scale bars, 20 μm
Fig. 7
Fig. 7
Astrocyte cultures infected with MSA prions do not show retraction of neuronal dendritic spines. TgM83+/− astrocytes were infected with MSA prions and maintained in an FBS-free medium for 21 days. Freshly isolated neuronal cultures from either (a, c) TgM83+/− or (b, d) Tg(SNCA+/+)Nbm P0 mice were plated on a layer of (a, b) control or (c, d) MSA-infected astrocytes. Cells were then cultured in FBS-free medium for 14 days. Immunostaining was carried out with pSyn (S129) (red) to reveal MSA prion infection and IIIβ-tubulin (white) to assess neuronal integrity. Insets of dashed areas are shown on right. Nuclei were stained with DAPI (blue). Scale bars, 50 μm
Fig. 8
Fig. 8
Hallmarks of synucleinopathies are recapitulated in cultured astrocytes infected with MSA. a Immunohistochemical detection of α-synuclein inclusions (red) in patient sample MSA2 (basal ganglia) (left), brain tissue from TgM83 mice inoculated with MSA2 (middle), and primary astrocyte culture infected with TgM83-passaged MSA2 prions. b Representative immunographs of high-power confocal microscopy of brain tissues and astrocyte culture from (a) immunostained for phosphorylated α-synuclein S129 (red) and ubiquitin (green; second row), p62 (green; third row), or amyloid detecting dye–FSB (green; fourth row). Nuclei were stained with DAPI (blue). Scale bars, (a) 200 μm, (b) 10 μm

References

    1. Anderson M, Bocharova OV, Makarava N, Breydo L, Salnikov VV, Baskakov IV. Polymorphism and ultrastructural organization of prion protein amyloid fibrils: an insight from high resolution atomic force microscopy. J Mol Biol. 2006;358:580–596. doi: 10.1016/j.jmb.2006.02.007. - DOI - PubMed
    1. Barmada SJ, Harris DA. Visualization of prion infection in transgenic mice expressing green fluorescent protein-tagged prion protein. J Neurosci. 2005;25:5824–5832. doi: 10.1523/JNEUROSCI.1192-05.2005. - DOI - PMC - PubMed
    1. Bernis ME, Babila JT, Breid S, Wüsten KA, Wüllner U, Tamgüney G. Prion-like propagation of human brain-derived alpha-synuclein in transgenic mice expressing human wild-type alpha-synuclein. Acta Neuropathol Commun. 2015;3:75. doi: 10.1186/s40478-015-0254-7. - DOI - PMC - PubMed
    1. Bjørkøy G, Lamark T, Brech A, Outzen H, Perander M, Øvervatn A, Stenmark H, Johansen T. p62/SQSTM1 forms protein aggregates degraded by autophagy and has a protective effect on huntingtin-induced cell death. J Cell Biol. 2005;171:603–614. doi: 10.1083/jcb.200507002. - DOI - PMC - PubMed
    1. Bourdenx M, Dehay B, Bezard E. Experimental modelling of α-synuclein aggregation and spreading in synucleinopathies. Bull Acad Natl Med. 2015;199:797–808. - PubMed

Publication types

LinkOut - more resources