. 2019 Jul 17;39(29):5697-5710.
doi: 10.1523/JNEUROSCI.2320-18.2019. Epub 2019 May 20.

The Augmentation of Retinogeniculate Communication during Thalamic Burst Mode

Affiliations

The Augmentation of Retinogeniculate Communication during Thalamic Burst Mode

Henry Alitto et al. J Neurosci. .

Abstract

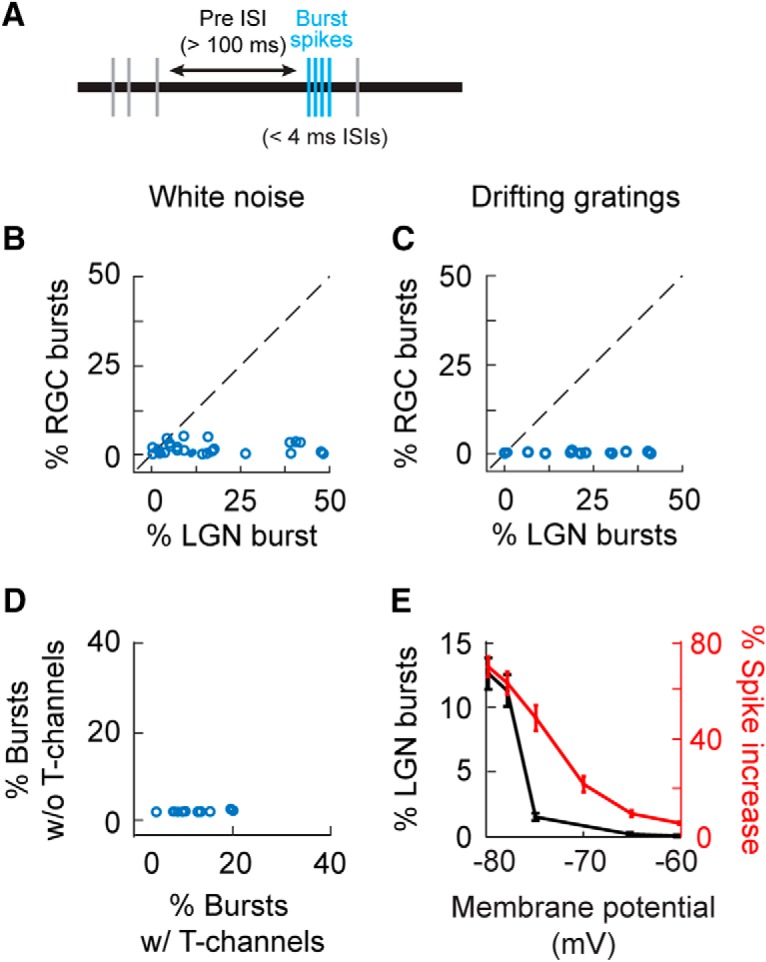
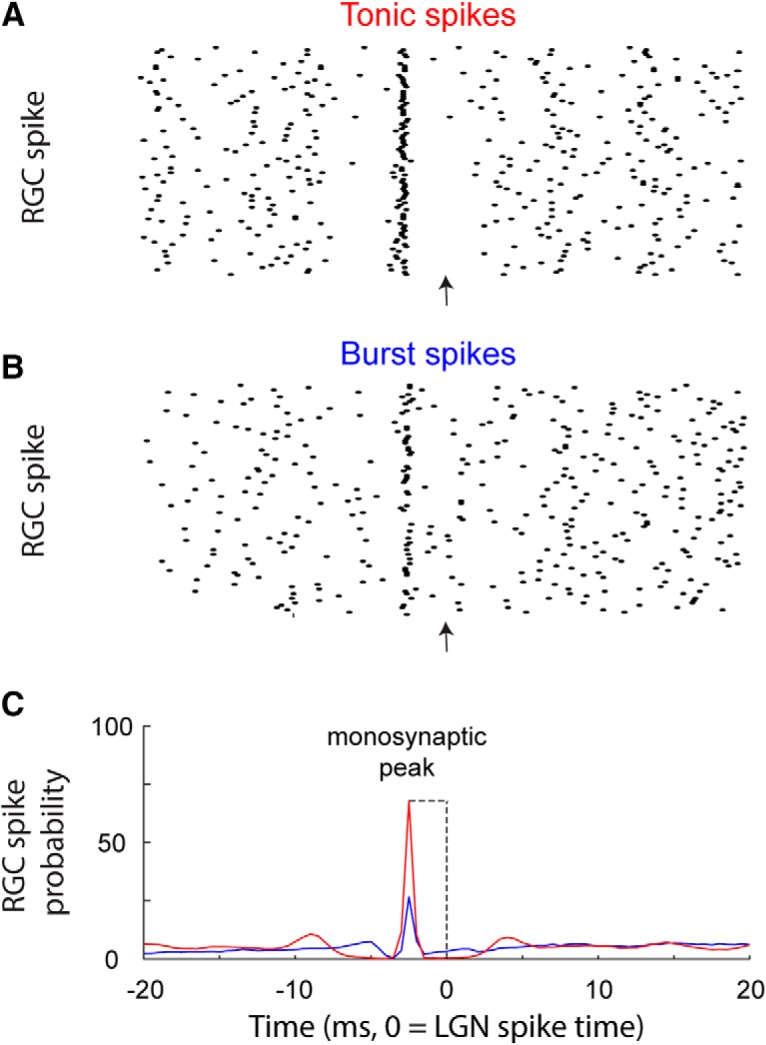
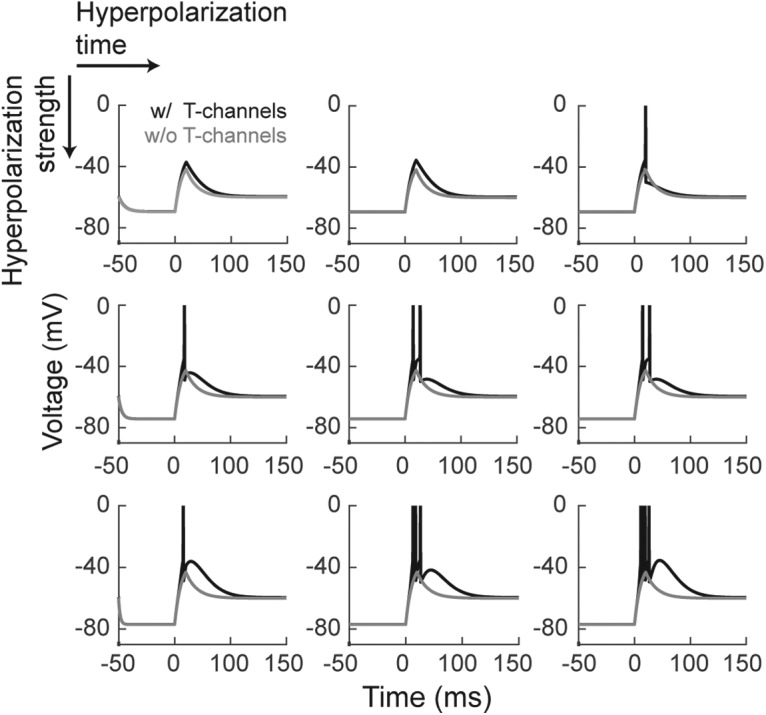
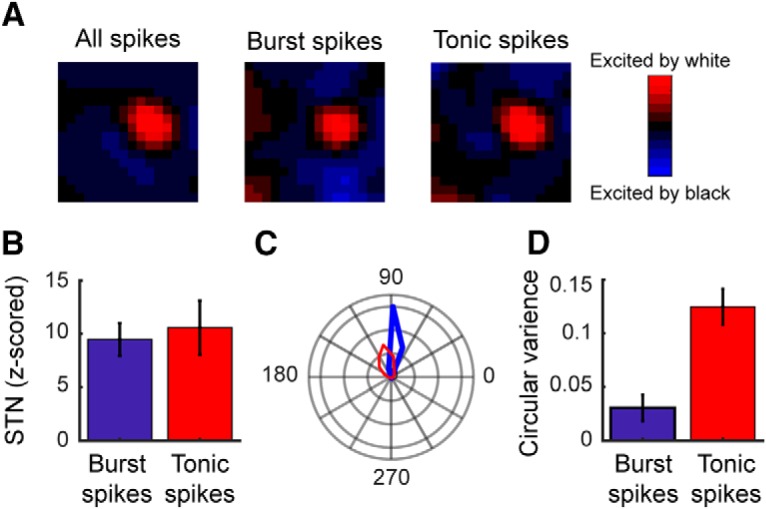
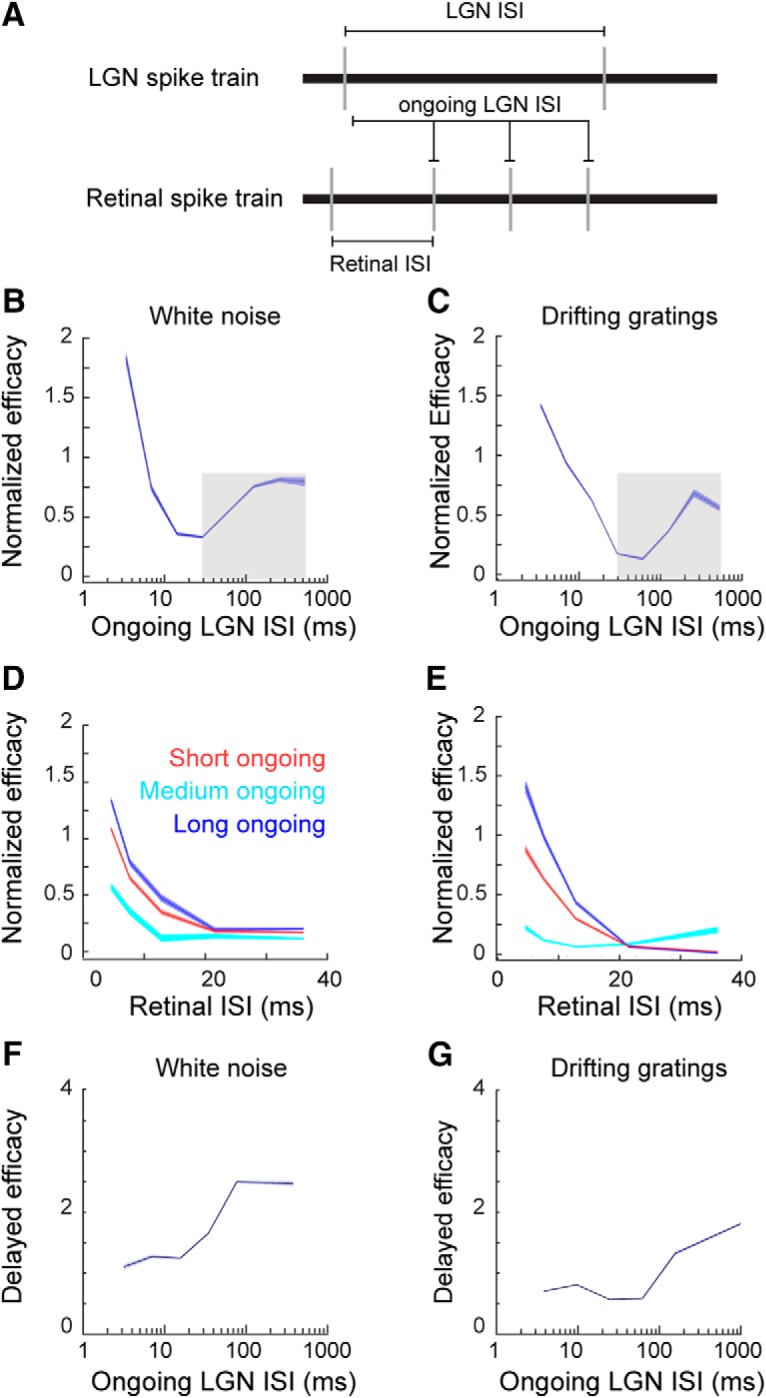
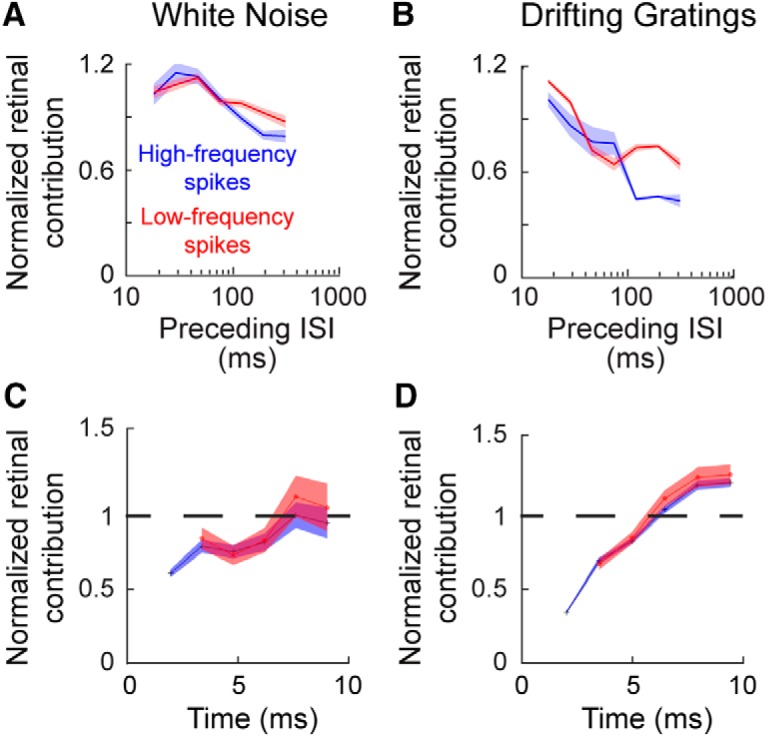
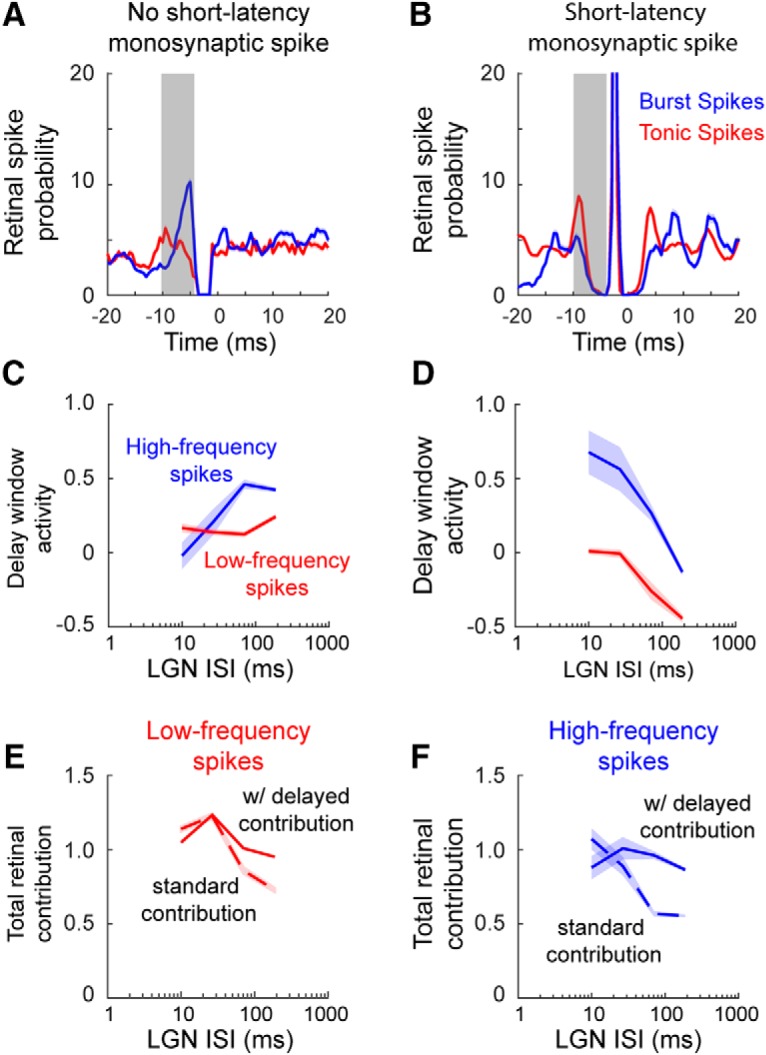
Retinal signals are transmitted to cortex via neurons in the lateral geniculate nucleus (LGN), where they are processed in burst or tonic response mode. Burst mode occurs when LGN neurons are sufficiently hyperpolarized for T-type Ca2+ channels to deinactivate, allowing them to open in response to depolarization, which can trigger a high-frequency sequence of Na+-based spikes (i.e., burst). In contrast, T-type channels are inactivated during tonic mode and do not contribute to spiking. Although burst mode is commonly associated with sleep and the disruption of retinogeniculate communication, bursts can also be triggered by visual stimulation, thereby transforming the retinal signals relayed to the cortex. To determine how burst mode affects retinogeniculate communication, we made recordings from monosynaptically connected retinal ganglion cells and LGN neurons in male/female cats during visual stimulation. Our results reveal a robust augmentation of retinal signals within the LGN during burst mode. Specifically, retinal spikes were more effective and often triggered multiple LGN spikes during periods likely to have increased T-type Ca2+ channel activity. Consistent with the biophysical properties of T-type Ca2+ channels, analysis revealed that effect magnitude was correlated with the duration of the preceding thalamic interspike interval and occurred even in the absence of classically defined bursts. Importantly, the augmentation of geniculate responses to retinal input was not associated with a degradation of visual signals. Together, these results indicate a graded nature of response mode and suggest that, under certain conditions, bursts facilitate the transmission of visual information to the cortex by amplifying retinal signals.SIGNIFICANCE STATEMENT The thalamus is the gateway for retinal information traveling to the cortex. The lateral geniculate nucleus, like all thalamic nuclei, has two classically defined categories of spikes-tonic and burst-that differ in their underlying cellular mechanisms. Here we compare retinogeniculate communication during burst and tonic response modes. Our results show that retinogeniculate communication is enhanced during burst mode and visually evoked thalamic bursts, thereby augmenting retinal signals transmitted to cortex. Further, our results demonstrate that the influence of burst mode on retinogeniculate communication is graded and can be measured even in the absence of classically defined thalamic bursts.

Keywords: LGN; cortex; retina; thalamus; vision.


Figures

Figure 1.
Figure 1.
Comparison of burst frequency in the retina and LGN. A, Bursts (blue tick marks) were identified by applying the following criteria to extracellular recordings: (1) the first spike was preceded by an ISI >100 ms (horizontal arrow) and (2) subsequent spikes followed with ISIs of <4 ms. B, C, Scatterplot showing the percentage of RGC and LGN cell spikes that were identified as part of a burst, during white noise (B) and drifting grating (C) stimulation. D, Scatterplot showing the percentage of simulated LGN spikes that were identified as part of a burst when a leaky integrate-and-fire mode either included or did not include T-channels. E, Line graph showing the influence of membrane potential on the percentage of LGN spikes that were identified as part of a burst when the simulation included T-channels (left y-axis, black line) and the increase in simulated LGN spike count due to the addition of T-channels to the model (right y-axis, red line). Error bars indicate SE.
Figure 2.
Figure 2.
Cross-correlation analysis to identify monosynaptic connections between RGCs and LGN neurons. A, Raster plot showing the timing of RGC action potentials relative to the tonic action potentials of a simultaneously recorded LGN (time = 0, indicated with arrow). B, A similar plot for LGN burst action potentials. C, A clear, narrow, short-latency peak can be seen in both of the example cross-correlograms (red, tonic spikes; blue, burst spikes), indicating a monosynaptic connection between the two neurons. Note: cross-correlation analysis can be performed using either the presynaptic spikes or postsynaptic spikes as the reference events. Here, we use the postsynaptic spikes for the reference to illustrate differences in retinal activity preceding burst and tonic spikes (see Materials and Methods).
Figure 3.
Figure 3.
Leaky integrate-and-fire simulation of geniculate bursts. Simulation of T-potentials using a standard integrate-and-fire neural model. Using previously published equations (see Materials and Methods), we simulated the influence of increasing the amplitude (progressively stronger by row) and duration (progressively longer by column) of a hyperpolarization on T-channel activation in response to depolarization. Black lines, Model with T-channels; gray lines, model without T-channels.
Figure 4.
Figure 4.
The influence of the preceding ISI on high-frequency spiking in the retina and LGN. A, B, Line plots showing the influence of the preceding ISI on the percentage of high-frequency spikes (red line, RGC; blue line, LGN) during white-noise (A) and drifting grating (B) stimulation. High-frequency spikes are defined as two or more consecutive spikes with ISIs of <4 ms. C, D, Line plots showing the influence of a preceding LGN ISI on the number of spikes per burst. Shaded regions indicate SE.
Figure 5.
Figure 5.
Geniculate bursts are evoked by visual stimulation. A, STRF maps from a representative LGN neuron calculated using specific subsets of spike count-matched geniculate spikes: all spikes (left), burst spikes (middle), and tonic spikes (right). B, Bar graph showing sample mean SNRs for tonic and burst STRFs. C, Polar plot illustrating the phase locking of LGN tonic (red line) and burst (blue line) spikes during visual stimulation with drifting gratings. D, Bar graph showing circular variance for tonic and burst spikes during visual stimulation with drifting gratings. Low circular variance values indicate that the spikes were phase locked to the visual stimulus, while a value of 1 indicates that the spikes occurred equally across all phases. Error bars indicate SE.
Figure 6.
Figure 6.
Retinal spike efficacy is influenced by ongoing LGN ISI. A, Ongoing LGN ISI is defined as the time since the most recent LGN spike at the occurrence of an RGC spike. This is in contrast to a retinal ISI, the interval between two consecutive RGC spikes, and an LGN ISI, the interval between two consecutive LGN spikes. B, C, Line plots showing the influence of an ongoing LGN ISI on retinal spike efficacy, during white-noise (B) and drifting grating (C) stimulation. The shaded areas around the line indicate SE. The gray boxes indicate the range of ISI values used for the GLME model (see Materials and Methods). D, E, Line plots showing the influence of retinal ISI on retinal spike efficacy (red, ongoing LGN ISI < 30 ms; light blue line, ongoing LGN ISI > 30 ms and < 100 ms; dark blue line, ongoing LGN ISI > 100 ms). F, G, Line plots showing the influence of an ongoing LGN ISI on delayed retinal spike efficacy.
Figure 7.
Figure 7.
Retinal spike efficacy is influenced by a preceding LGN ISI. A, To quantify the influence of an preceding LGN ISI on retinal spike efficacy, and time = 0 was set to 4.0 ms after the cardinal spike in a burst or the referenced tonic spike (black arrow). B, C, Line plot showing that retinal spike efficacy is enhanced following both burst spikes (blue line) and tonic spikes with a preceding ISI of >100 ms (red line). The expected values given the preceding retinal ISIs are plotted as a baseline comparison (black line). Shaded areas indicate SE. D, E, Line plots showing the influence of preceding ISI on retinal spike efficacy for 4–10 ms following time 0, as indicated in A.
Figure 8.
Figure 8.
The influence of a preceding LGN ISI on retinal contribution. A, B, Line plot showing the influence of a preceding LGN ISI on retinal spike contribution (red line, low-frequency spikes, subsequent ISI of >4 ms; blue line, high-frequency spikes, subsequent ISI of ≤4 ms). Shaded area indicates SE. C, D, Line plots showing the temporal duration of the influence shown in A and B. Time = 0 is set as the occurrence of the initial spike following the referenced ISI (e.g., time of the cardinal spike in a burst).
Figure 9.
Figure 9.
Cardinal burst spikes can be triggered by delayed retinal contribution. A, B, To quantify delayed retinal contribution, LGN spikes were divided into two categories: triggered by the recorded RGC (A) or not triggered by the recorded RGC (B). The window of delayed retinal contribution (gray box) was 0.5–10 ms before the monosynaptic peak. C, D, Delayed retinal contribution plotted as a function of a preceding LGN ISI. E, F, Total retinal contribution for cardinal burst spikes, plotted as a function of a preceding LGN ISI, is defined as classically defined retinal contribution (dashed lines) plus delayed retinal contribution.
Figure 10.
Figure 10.
Augmentation of retinal transmission during high-frequency LGN activity. A, B, The influence of a preceding LGN ISI on retinal contribution when the data are separated into two categories: cardinal spike was contributed by the recorded RGC (red line), and cardinal spike was not contributed by the recorded RGC (green). Shaded area indicates SE. C, D, Line plots showing retinal augmentation calculated from the data shown in A and B. E, F, Line plot showing standard retinal contribution (blue line), standard retinal contribution plus augmented contribution (orange line), and total retinal contribution augmentation (black line).
Figure 11.
Figure 11.
Burst spikes lacking a triggering RGC spike are nonetheless visually evoked. A–E, STRFs calculated from different subsets of spike count-matched LGN spikes: all spikes (A), tonic and burst spikes evoked by the recorded RGC (B, C), and tonic and burst spikes that were not evoked by the recorded RGC (D, E). F, G, Bar graphs showing signal-to-noise ratios for LGN spikes that were either evoked (F) or not evoked (G) by the recorded RGC (red, tonic spikes; blue, burst spikes). Error bars indicate SE.

References

    1. Alitto HJ, Weyand TG, Usrey WM (2005) Distinct properties of stimulus-evoked bursts in the lateral geniculate nucleus. J Neurosci 25:514–523. 10.1523/JNEUROSCI.3369-04.2005 - DOI - PMC - PubMed
    1. Alitto HJ, Moore BD 4th, Rathbun DL, Usrey WM (2011) A comparison of visual responses in the lateral geniculate nucleus of alert and anaesthetized macaque monkeys. J Physiol 589:87–99. 10.1113/jphysiol.2010.190538 - DOI - PMC - PubMed
    1. Alitto HJ, Rathbun DL, Fisher TG, Alexander PC, Usrey WM (2019) Contrast gain control and retinogeniculate communication. Eur J Neurosci 49:1061–1068 10.1111/ejn.13904 - DOI - PMC - PubMed
    1. Andersen P, Eccles J (1962) Inhibitory phasing of neuronal discharge. Nature 196:645–647. 10.1038/196645a0 - DOI - PubMed
    1. Babadi B. (2005) Bursting as an effective relay mode in a minimal thalamic model. J Comput Neurosci 18:229–243. 10.1007/s10827-005-6560-5 - DOI - PubMed

Publication types