. 2019 Jun 5;6(3):ENEURO.0126-19.2019.
doi: 10.1523/ENEURO.0126-19.2019. Print 2019 May/Jun.

Cerebellar Stellate Cell Excitability Is Coordinated by Shifts in the Gating Behavior of Voltage-Gated Na+ and A-Type K+ Channels

Affiliations

Cerebellar Stellate Cell Excitability Is Coordinated by Shifts in the Gating Behavior of Voltage-Gated Na+ and A-Type K+ Channels

Ryan P D Alexander et al. eNeuro. .

Abstract

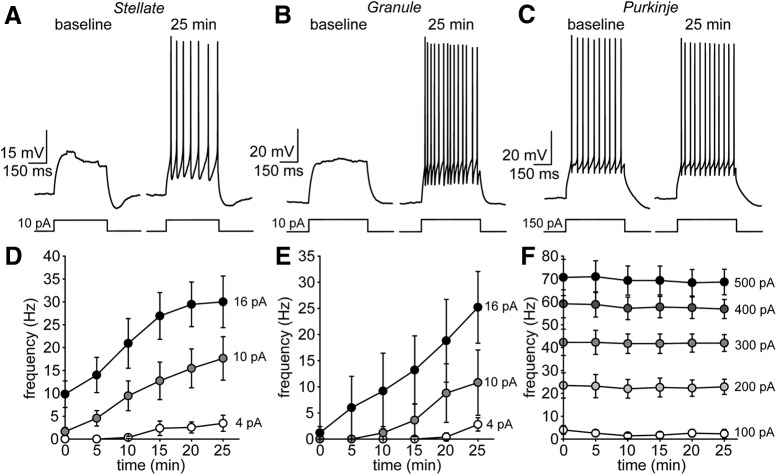
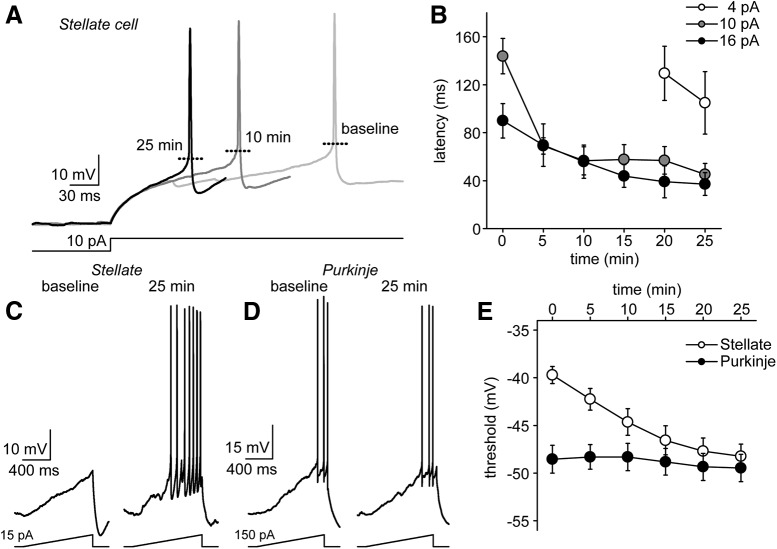
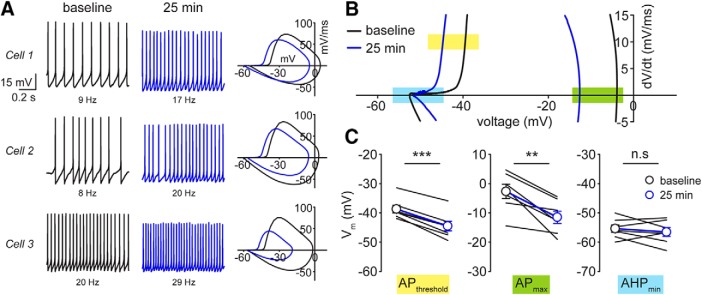
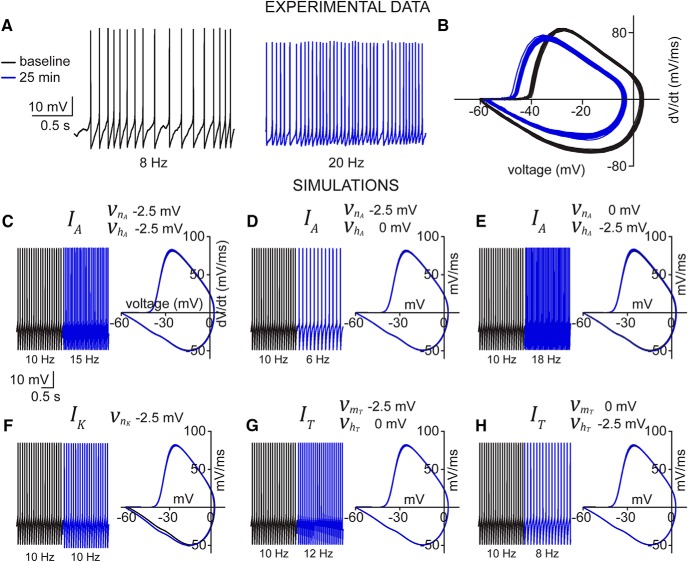
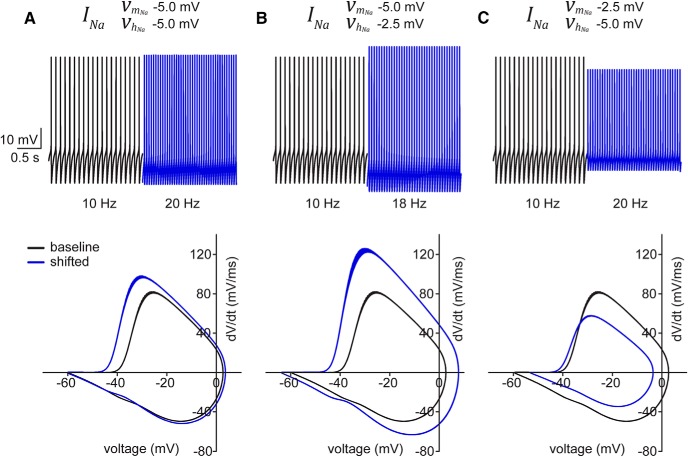
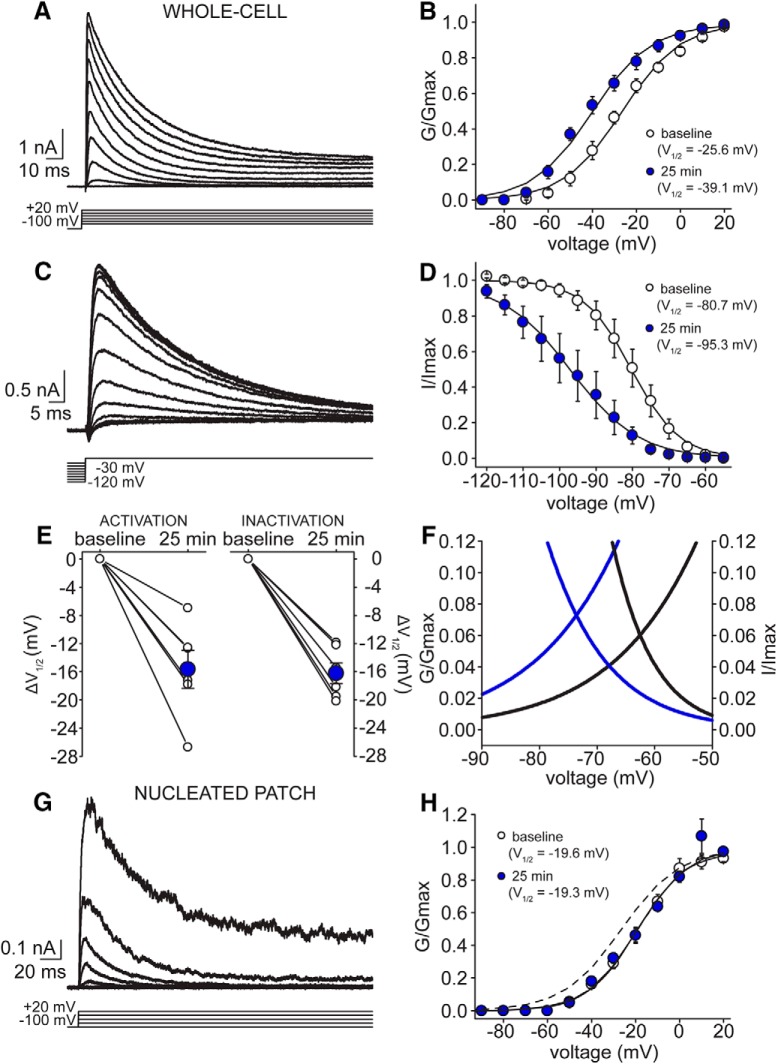
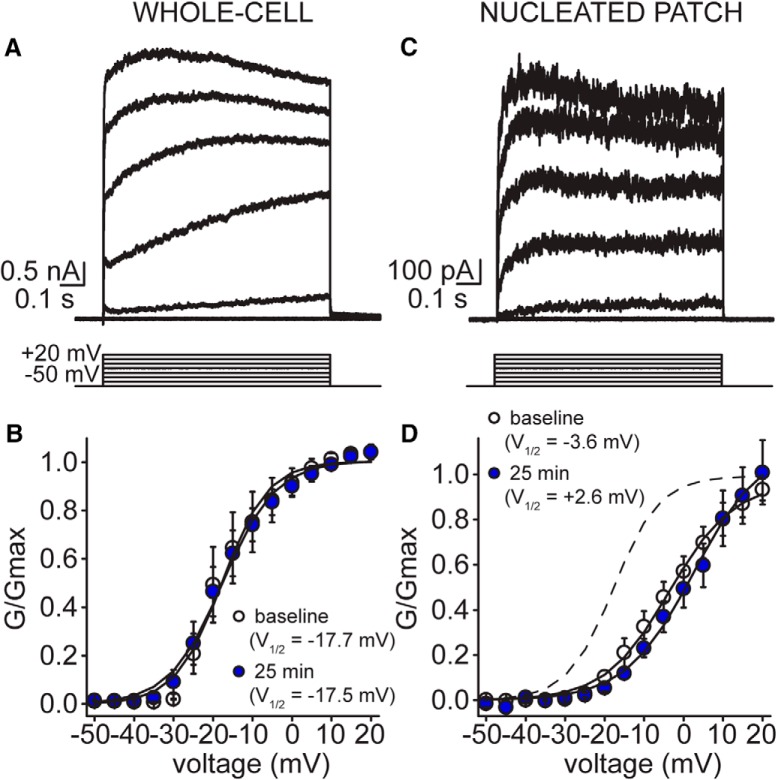
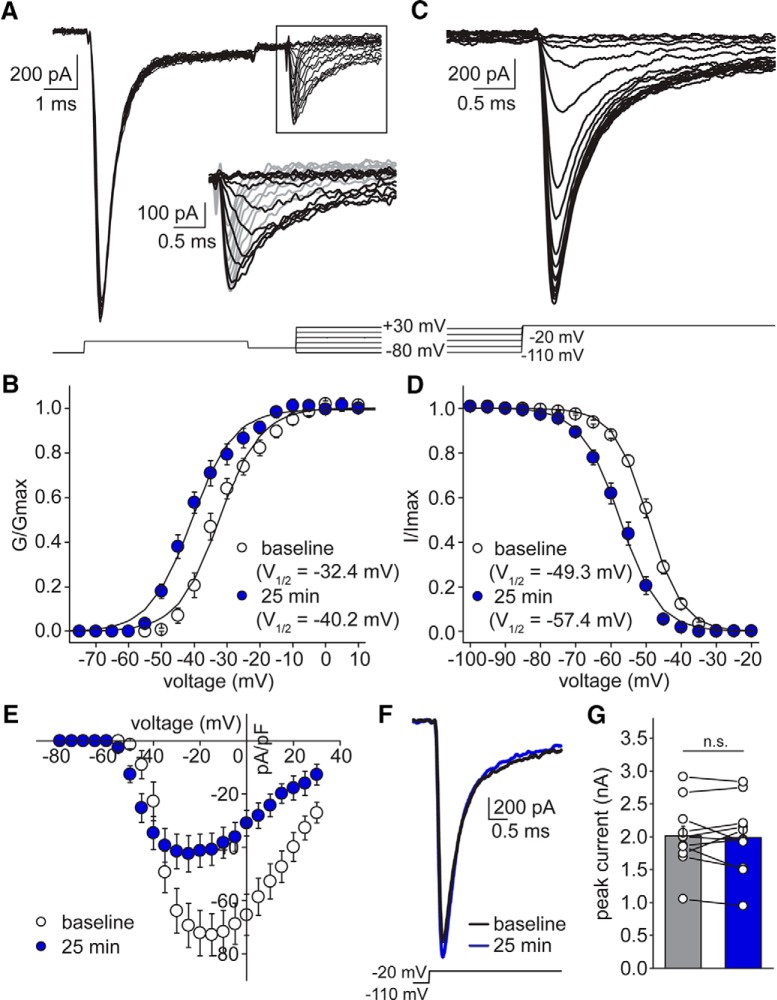
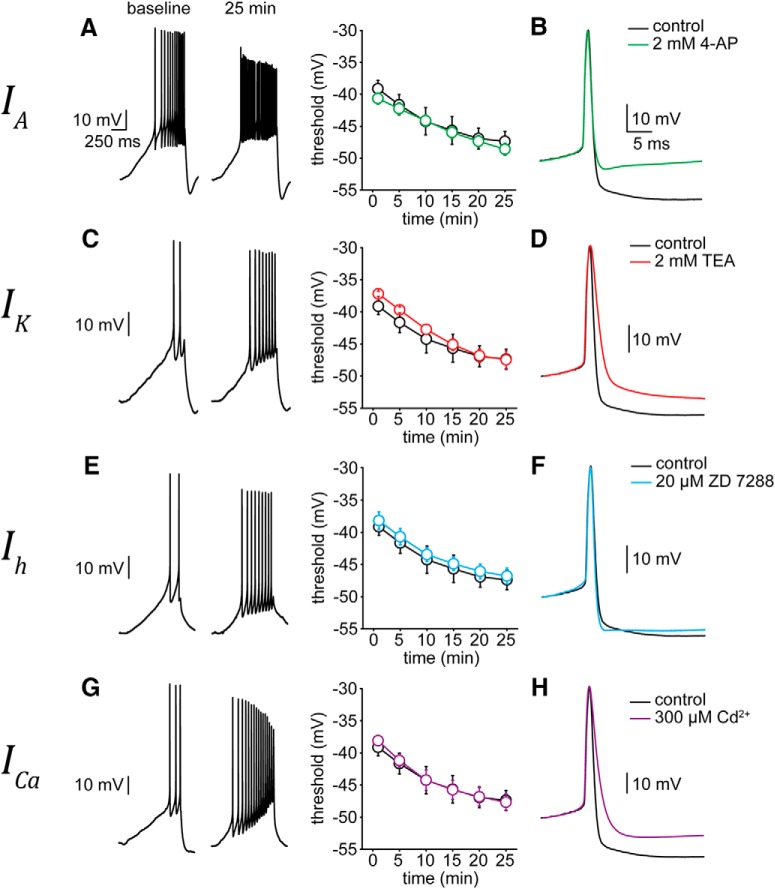
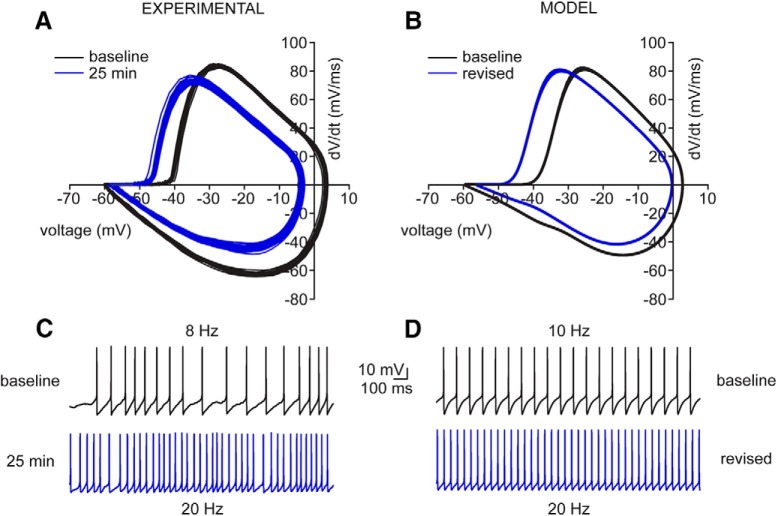
Neuronal excitability in the vertebrate brain is governed by the coordinated activity of both ligand- and voltage-gated ion channels. In the cerebellum, spontaneous action potential (AP) firing of inhibitory stellate cells (SCs) is variable, typically operating within the 5- to 30-Hz frequency range. AP frequency is shaped by the activity of somatodendritic A-type K+ channels and the inhibitory effect of GABAergic transmission. An added complication, however, is that whole-cell recording from SCs induces a time-dependent and sustained increase in membrane excitability making it difficult to define the full range of firing rates. Here, we show that whole-cell recording in cerebellar SCs of both male and female mice augments firing rates by reducing the membrane potential at which APs are initiated. AP threshold is lowered due to a hyperpolarizing shift in the gating behavior of voltage-gated Na+ channels. Whole-cell recording also elicits a hyperpolarizing shift in the gating behavior of A-type K+ channels which contributes to increased firing rates. Hodgkin-Huxley modeling and pharmacological experiments reveal that gating shifts in A-type K+ channel activity do not impact AP threshold, but rather promote channel inactivation which removes restraint on the upper limit of firing rates. Taken together, our work reveals an unappreciated impact of voltage-gated Na+ channels that work in coordination with A-type K+ channels to regulate the firing frequency of cerebellar SCs.

Keywords: A-type potassium channel; action potential; cerebellum; computational modeling; sodium channel; stellate cell.


Figures

Figure 1.
Figure 1.
Stellate and GC (granule cell), but not Purkinje cells, exhibit excitability increases during whole-cell recording. A, Example SC current-clamp recording (patch #150129p2) applying a 10-pA step protocol shortly following breakthrough and after 25 min. B, C, Same for GC (patch #150324p2) and Purkinje cell (patch #141010p5) examples using 10- and 150-pA current steps, respectively. D, Summary SC AP frequency over 25-min recording for multiple step amplitudes (n = 11 cells). E, F, Same for granule (n = 6 cells) and Purkinje cells (n = 6 cells).
Figure 2.
Figure 2.
Excitability increase is underpinned by decrease in spike latency and hyperpolarization of AP threshold. A, First APs fired by a SC in response to 10-pA current step at three different time points: 1, 10, and 25 min after breakthrough. The spike latency in response to the step decreases substantially over the course of the recording. B, Summary plot of spike latencies for multiple step amplitudes over the course of a 25-min recording (n = 11 cells). C, Example current-clamp responses evoked by ramp protocol at baseline (left) and after 25 min (right) in a SC (patch #150129p2). D, Same for an example Purkinje cell (patch #141010p5). E, Summary plot depicting change in AP threshold over time in stellate (n = 11 cells) and Purkinje cells (n = 6 cells).
Figure 3.
Figure 3.
Defining the hallmark membrane features of SC excitability increase. A, left panels, Spontaneous AP firing traces from three example SCs at baseline (black) and after 25 min (blue; patch #150129p2, #181111p6, #181109p3). Right panels, AP cycles for each cell calculated from voltage-time data at baseline (black) and 25 min (blue). B, AP cycle plot of an example SC with y-axis expanded. Colored rectangles designate quantities of interest (yellow, AP threshold; green, AP maximum; light blue, AHP minimum). C, Summary comparison of these three features measured from individual AP cycles (n = 7 cells). *** denotes p < 0.001, ** denotes p < 0.01, n.s denotes p > 0.05.
Figure 4.
Figure 4.
Simulating IA, IK, and IT shifts predicts little contribution to excitability increase. A, Example SC current-clamp recording depicting spontaneous AP firing at baseline (black) and after 25 min (blue; patch #181111p5). B, AP cycle calculated from current-clamp data from A at baseline (black) and 25 min (blue). C–E, Simulated spontaneous firing and AP cycle from baseline model (black) and after making symmetric and asymmetric shifts in vnA and vhA(blue). F, Same for IK after shifting vnK(blue). G, H, Same for IT after shifting either vmT or vhT.
Figure 5.
Figure 5.
Simulated INa shifts suggest primary role for sodium channel in excitability increase. Simulated spontaneous firing (upper panels) and AP cycles (lower panels) from baseline model (black) and after either symmetric (A) or asymmetric (B, C) shifts in vmNa and vhNa.
Figure 6.
Figure 6.
IA exhibits shifts in both activation and inactivation during 25-min recording. A, Example voltage-clamp traces of IA currents at baseline during activation protocol (patch #171024p3). B, Summary plot of voltage dependence of activation of IA at baseline (white circles) and after 25 min of recording (blue circles; n = 7 cells). C, Example voltage-clamp traces of IA currents evoked during inactivation protocol (patch #171127p3). D, Summary plot of voltage dependence of inactivation of IA at baseline (white circles) and after 25 min of recording (blue circles; n = 7 cells, same as in B). E, Normalized V1/2 activation (left) and inactivation (right) compared to delta shift after 25-min recording for each cell (white circles), along with summary mean delta for each measure (blue circles). F, Zoom-in of Boltzmann fits for both voltage dependence of activation and inactivation at baseline (black lines) and at 25 min (blue lines) from B, D, respectively, depicting symmetrical translocation of IA window current. G, Example voltage-clamp traces of IA currents during activation protocol observed in a SC nucleated patch (patch #180510p3). F, Summary plot of voltage dependence of activation of IA at baseline (white circles) and 25 min (blue circles; n = 6 patches). Dashed line depicts baseline activation curve measured in whole-cell configuration from B.
Figure 7.
Figure 7.
IK voltage dependence of activation remains stable over patch-clamp recording in both whole-cell and nucleated patch configurations. A, Example whole-cell voltage-clamp traces of delayed rectifier K+ current at baseline during activation protocol evoked from –50-mV holding potential (5-mV increments, up to +20 mV; patch #180521p2). B, Summary plot of voltage dependence of activation of delayed rectifier K+ current at baseline (white circles) and after 25 min of recording (blue circles; n = 8 cells). C, Example voltage-clamp traces after excising a nucleated patch of delayed rectifier K+ current at baseline during activation protocol evoked from –50-mV holding potential (5-mV increments, up to +20 mV; patch #180510p3). D, Summary plot of voltage dependence of activation of delayed rectifier K+ current at baseline (white circles) and after 25 min of recording (blue circles; n = 6 cells). Dashed line depicts baseline activation curve measured in whole-cell configuration from B.
Figure 8.
Figure 8.
Na+ current SCs exhibits shift in both activation and inactivation properties, but not current density. A, Example voltage-clamp traces of Na+ currents evoked with a prepulse protocol (patch #170222p4). Inset, Zoom-in of portion of traces depicting strong voltage-clamp of Na+ currents evoked after prepulse. B, Summary plot of voltage dependence of activation of Na+ current at baseline (white circles) and at 25 min (blue circles; n = 11 cells). C, Example traces from a Na+ inactivation protocol (patch #170222p4). D, Summary plot of voltage dependence of inactivation at baseline (white circles) and at 25 min (blue circles; n = 11 cells). E, Summary current density-voltage plot (data used to construct conductance-voltage plots in B, D, of sodium responses at baseline (white circles) and at 25 min (blue circles). F, Example peak sodium current traces evoked by a –110 to –20 mV probe at baseline (black) and at 25 min (blue; patch #171108p3). G, Summary graph of peak sodium currents evoked from a holding potential of –110 mV at baseline (gray) and at 25 min (blue). n.s. denotes p > 0.05.
Figure 9.
Figure 9.
AP threshold hyperpolarization persists with pharmacological blockade of IK, IA, ICa and Ih. A, left panel, Example traces recorded at baseline and after 25 min of APs evoked by a current ramp protocol (25 pA over 1 s) in a SC. Right panel, Summary AP threshold data for control conditions (black open circles; n = 6 cells) and in the presence of 2 mM TEA in the aCSF (red open circles; n = 5 cells). B, Superimposed first APs evoked by ramp protocol in control (black) and external TEA (red) conditions. TEA scaled to control (patch #181008p8). C, D, Same as A, B, but in the presence of 2 mM 4-AP (green lines; n = 5 cells; patch #181015p7). E, F, Same as A, B, but in the presence of 20 µM ZD 7288 (blue lines; n = 6 cells; patch #181018p2). G, H, Same as in A, B, but in the presence of 200–300 µM CdCl2 (purple lines; n = 5 cells; patch #181024p4).
Figure 10.
Figure 10.
Voltage-clamp-informed model recapitulates the dynamics of current-clamp experimental data. A, AP cycle calculated from experimental SC current-clamp recording at baseline (black) and 25 min (blue). C, Same current-clamp recording data as above, presented as voltage versus time at baseline (black) and 25 min (blue). B, Simulated AP cycle of baseline (black) and revised (blue) models after modifying all gating parameters based on values measured experimentally in voltage-clamp in SCs. D, Simulated firing properties of baseline (black) and revised (blue) models.

References

    1. Alcami P, Franconville R, Llano I, Marty A (2012) Measuring the firing rate of high-resistance neurons with cell-attached recording. J Neurosci 32:3118–3130. 10.1523/JNEUROSCI.5371-11.2012 - DOI - PMC - PubMed
    1. Anderson D, Mehaffey WH, Iftinca M, Rehak R, Engbers JD, Hameed S, Zamponi GW, Turner RW (2010) Regulation of neuronal activity by Cav3-Kv4 channel signaling complexes. Nat Neurosci 13:333–337. 10.1038/nn.2493 - DOI - PubMed
    1. Anderson D, Engbers JD, Heath NC, Bartoletti TM, Mehaffey WH, Zamponi GW, Turner RW (2013) The Cav3-Kv4 complex acts as a calcium sensor to maintain inhibitory charge transfer during extracellular calcium fluctuations. J Neurosci 33:7811–7824. 10.1523/JNEUROSCI.5384-12.2013 - DOI - PMC - PubMed
    1. Armstrong DM, Rawson JA (1979) Activity patterns of cerebellar cortical neurones and climbing fibre afferents in the awake cat. J Physiol 289:425–448. 10.1113/jphysiol.1979.sp012745 - DOI - PMC - PubMed
    1. Astorga G, Li D, Therreau L, Kassa M, Marty A, Llano I (2017) Concerted interneuron activity in the cerebellar molecular layer during rhythmic oromotor behaviors. J Neurosci 37:11455–11468. 10.1523/JNEUROSCI.1091-17.2017 - DOI - PMC - PubMed

Publication types

Substances

LinkOut - more resources