. 2019 May 20;10(1):2240.
doi: 10.1038/s41467-019-10152-w.

Aβ34 is a BACE1-derived degradation intermediate associated with amyloid clearance and Alzheimer's disease progression

Affiliations

Aβ34 is a BACE1-derived degradation intermediate associated with amyloid clearance and Alzheimer's disease progression

Filip Liebsch et al. Nat Commun. .

Abstract

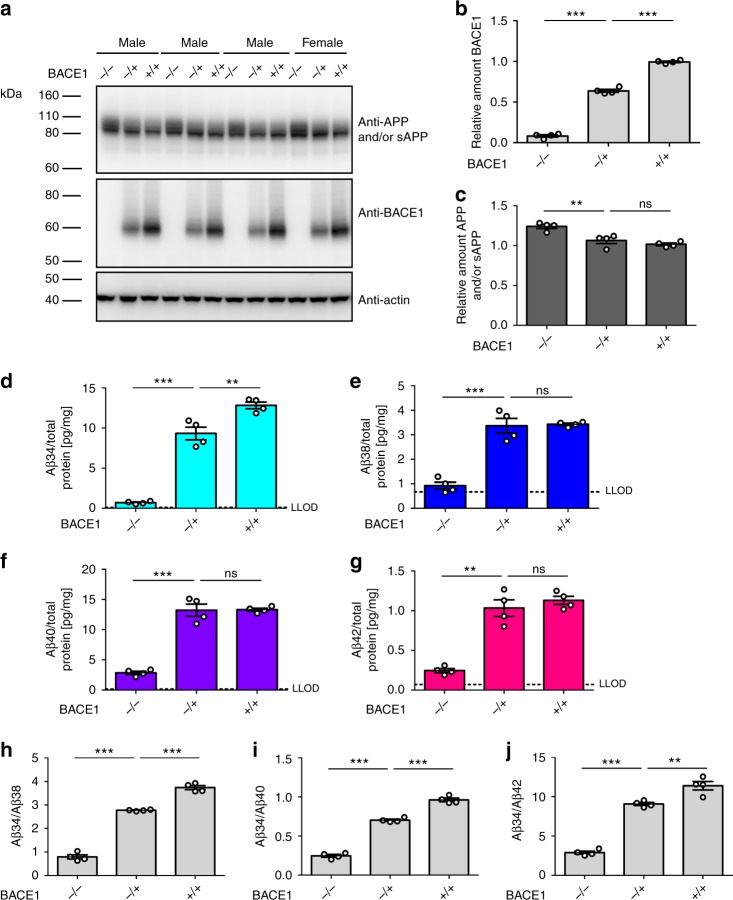
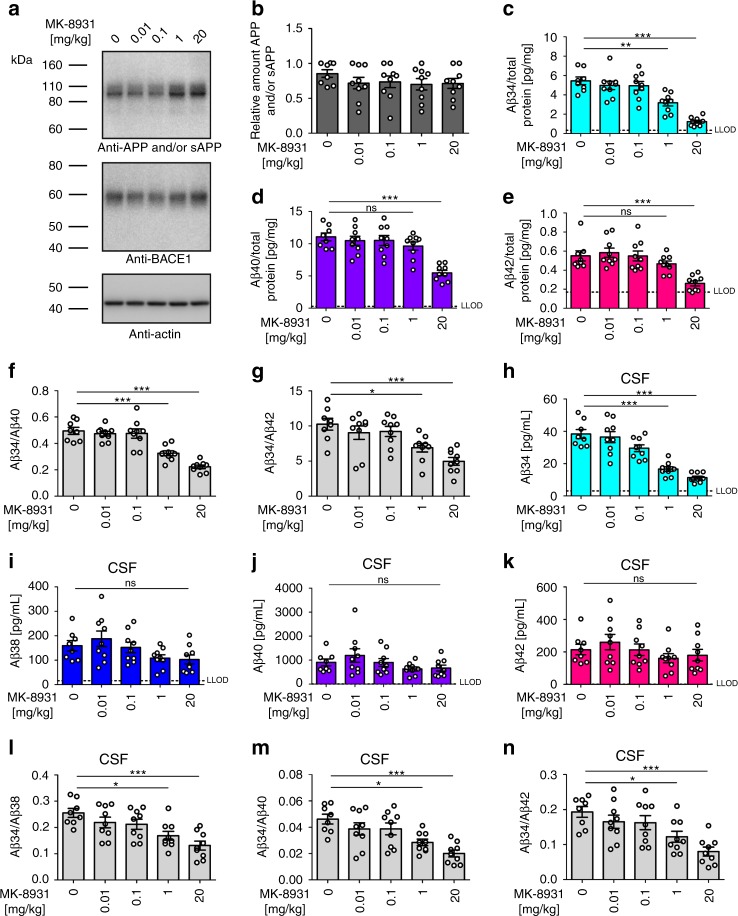
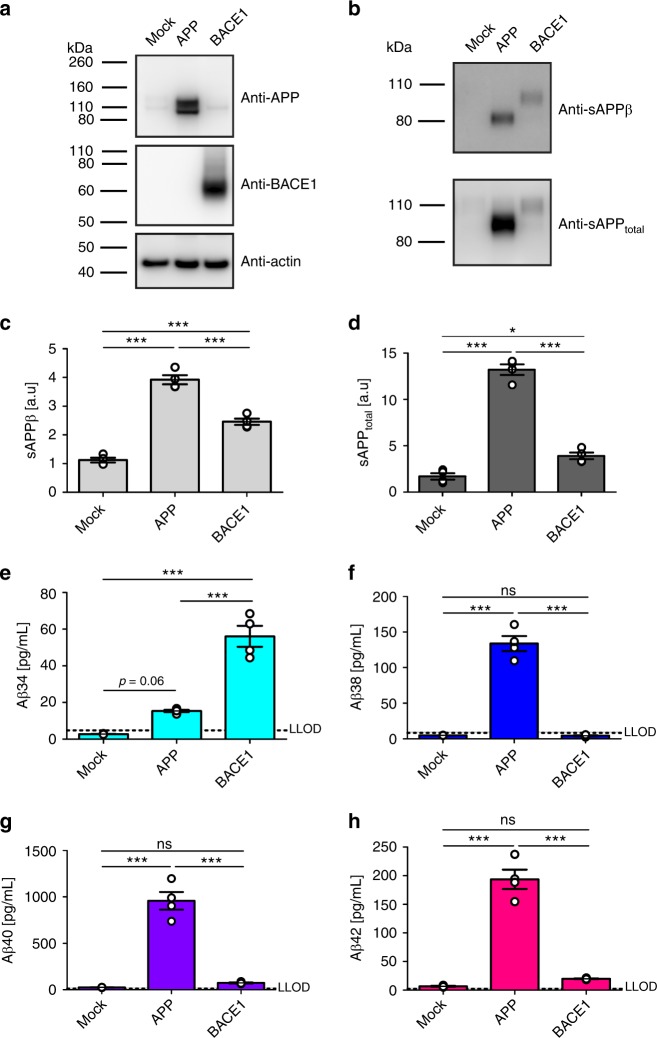
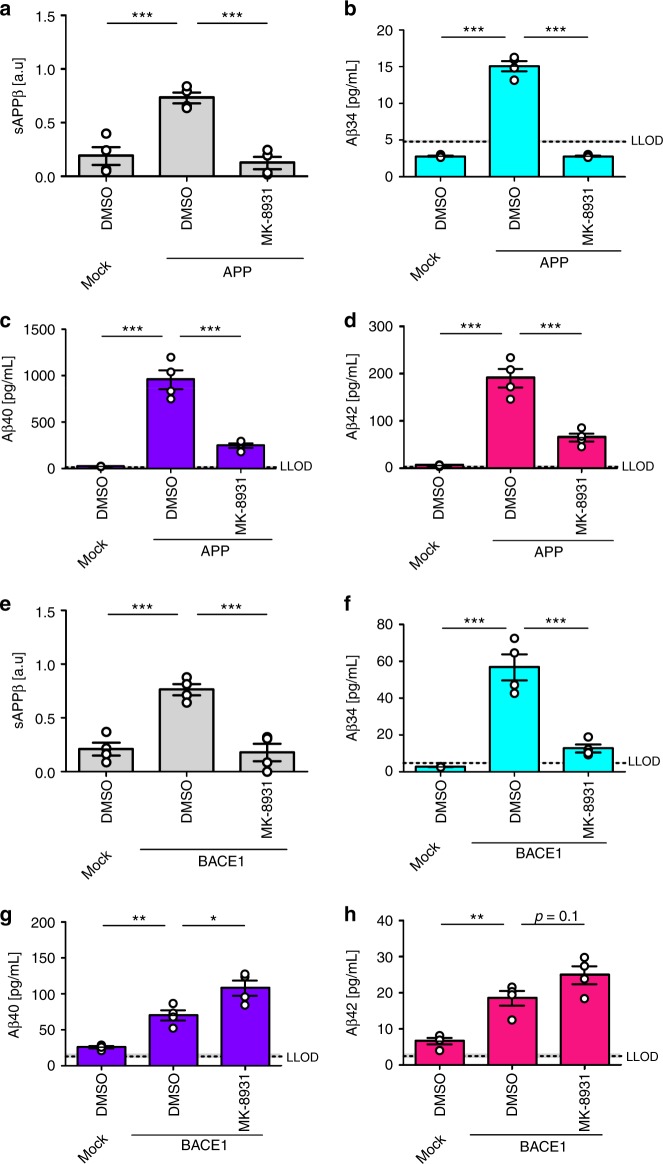
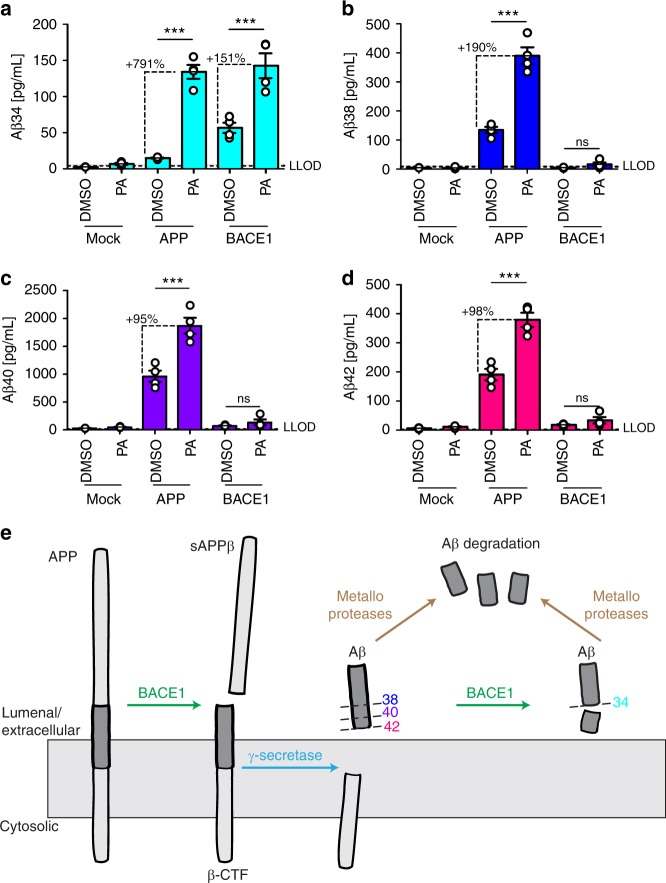
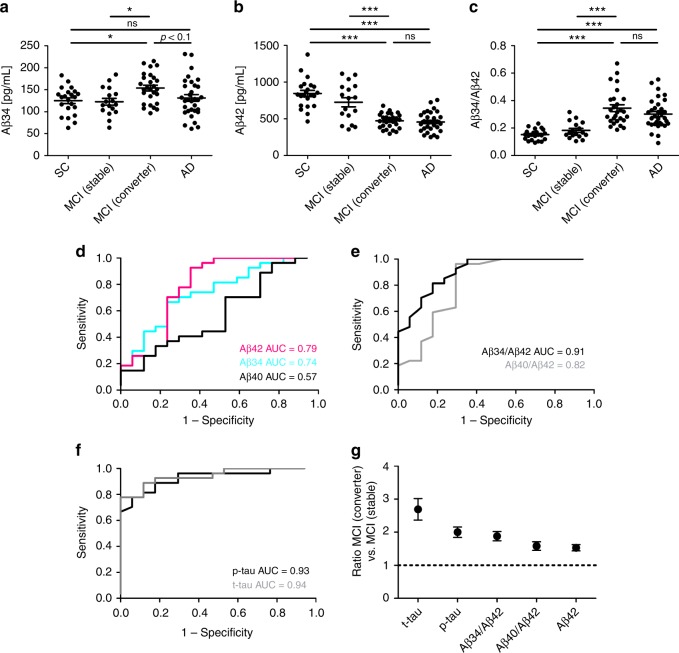
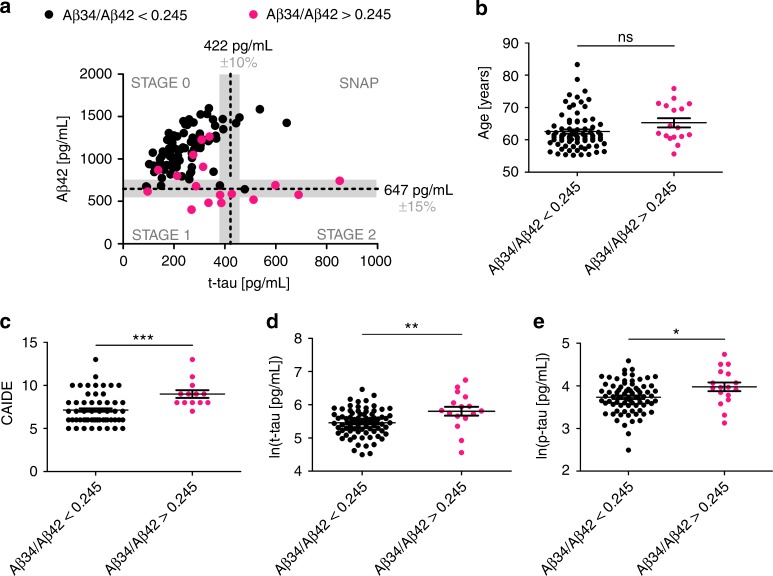
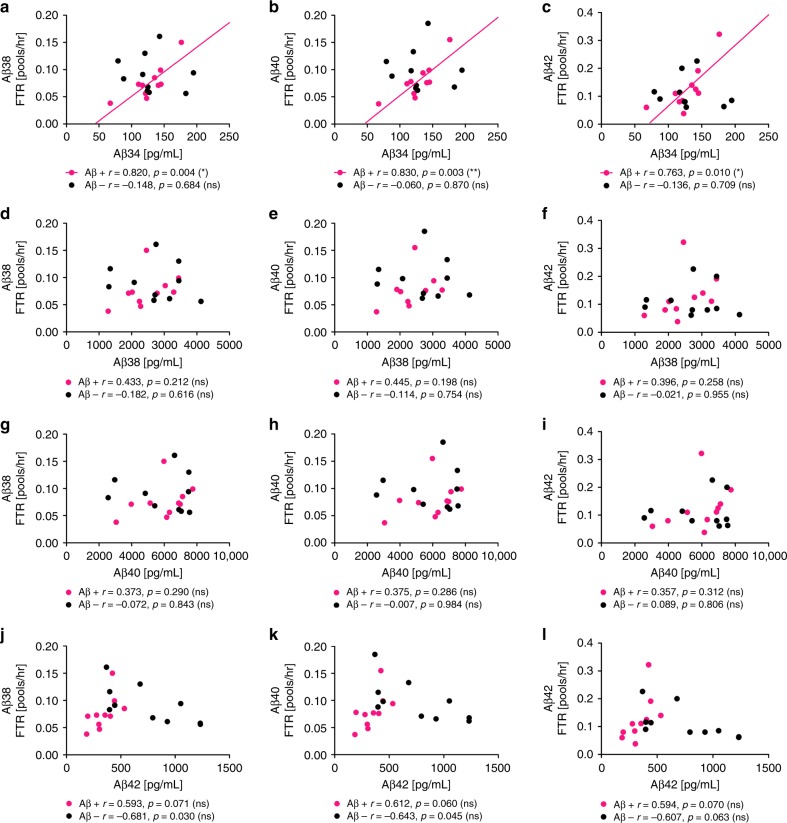
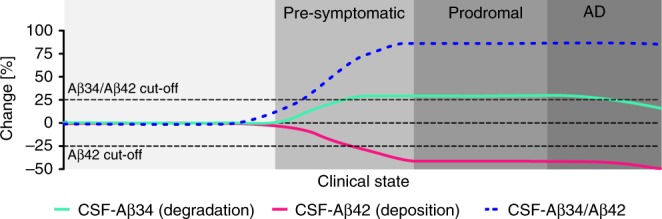
The beta-site APP cleaving enzyme 1 (BACE1) is known primarily for its initial cleavage of the amyloid precursor protein (APP), which ultimately leads to the generation of Aβ peptides. Here, we provide evidence that altered BACE1 levels and activity impact the degradation of Aβ40 and Aβ42 into a common Aβ34 intermediate. Using human cerebrospinal fluid (CSF) samples from the Amsterdam Dementia Cohort, we show that Aβ34 is elevated in individuals with mild cognitive impairment who later progressed to dementia. Furthermore, Aβ34 levels correlate with the overall Aβ clearance rates in amyloid positive individuals. Using CSF samples from the PREVENT-AD cohort (cognitively normal individuals at risk for Alzheimer's disease), we further demonstrate that the Aβ34/Aβ42 ratio, representing Aβ degradation and cortical deposition, associates with pre-clinical markers of neurodegeneration. We propose that Aβ34 represents a marker of amyloid clearance and may be helpful for the characterization of Aβ turnover in clinical samples.


Conflict of interest statement

The authors declare no competing interests.

Figures

Fig. 1
Fig. 1
Endogenous BACE1 generates Aβ34 in the murine brain. Endogenous levels of murine APP and/or sAPP, BACE1, and Aβ in BACE1−/−, BACE1+/−, and wild-type littermates (+/+). N = 4 animals per group. Western blot of endogenous APP and/or sAPP and BACE1 expression in male and female mice (a) and corresponding quantification of relative protein amounts of BACE1 (b) and APP and/or sAPP (c). Quantification (pg/mg total protein) of absolute amounts of Aβ34 (d), Aβ38 (e), Aβ40 (f), and Aβ42 (g) as determined by custom 4-plex MSD multiplexing assays. Ratios of Aβ34/Aβ38 (h), Aβ34/Aβ40 (i), and Aβ34/Aβ42 (j) are displayed. Statistics: b one-way ANOVA, F(2, 9) = 1021, p < 0.0001, c one-way ANOVA, F(2, 9) = 17.28, p < 0.001, d one-way ANOVA, F(2, 9) = 145.7, p < 0.0001, e one-way ANOVA, F(2, 9) = 53.68, p < 0.0001, f one-way ANOVA, F(2, 9) = 95.65, p < 0.0001, g one-way ANOVA, F(2, 9) = 49.70, p < 0.0001, h one-way ANOVA, F(2, 9) = 425.2, p < 0.0001, i one-way ANOVA, F(2, 9) = 378.0, p < 0.0001, j one-way ANOVA, F(2, 9) = 157.6, p < 0.0001. Bars and error bars indicate mean ± s.e.m. Tukey’s post-hoc tests were performed for pairwise comparisons; selected comparisons are highlighted ***p < 0.001, **p < 0.01, ns = nonsignificant p > 0.05. For each target, the MSD software computes the lower limit of detection (LLOD) as 2.5 standard deviations above the blank
Fig. 2
Fig. 2
Pharmacological inhibition of Aβ34 generation in rats. Endogenous levels of APP and/or sAPP, BACE1, and Aβ in rats 1 h after intravenous injection of the indicated concentrations (mg/kg) of the BACE1-specific inhibitor (MK-8931) n = 9 animals per group or vehicle n = 8 animals. Western blot of endogenous APP and/or sAPP and BACE1 expression (a) and corresponding quantification of relative protein amounts of APP and/or sAPP (b). Quantification (pg/mg total protein) of absolute amounts of Aβ34 (c), Aβ40 (d), and Aβ42 (e) as determined by custom MSD multiplexing assays. Ratios of Aβ34/Aβ40 (f) and Aβ34/Aβ2 (g) are displayed. Quantification of CSF levels of Aβ34 (h), Aβ38 (i), Aβ40 (j), and Aβ42 (k), as well as display of the ratios Aβ34/Aβ38 (l), Aβ34/Aβ40 (m), and Aβ34/Aβ42 (n). Statistics: b one-way ANOVA, F(4, 39) = 0.63, p > 0.05, c one-way ANOVA, F(4, 39) = 22.40, p < 0.0001, d one-way ANOVA, F(4, 39) = 12.81, p < 0.0001, e one-way ANOVA, F(4, 39) = 9.38, p < 0.0001, f one-way ANOVA, F(4, 39) = 25.93, p < 0.0001, g one-way ANOVA, F(4, 39) = 8.02, p < 0.0001, h one-way ANOVA, F(4, 39) = 26.55, p < 0.0001, i one-way ANOVA, F(4, 39) = 2.69, p < 0.05, j one-way ANOVA, F(4, 39) = 1.71, p > 0.05, k one-way ANOVA, F(4, 39) = 1.09, p > 0.05, l one-way ANOVA, F(4, 39) = 6.87, p < 0.001, m one-way ANOVA, F(4, 39) = 7.36, p < 0.001, n one-way ANOVA, F(4, 39) = 6.74, p < 0.001. Bars and error bars indicate mean ± s.e.m. Tukey’s post-hoc tests were performed for pairwise comparisons; selected comparisons are highlighted ***p < 0.001, **p < 0.01, *p < 0.05, ns = nonsignificant p > 0.05
Fig. 3
Fig. 3
Surplus of APP or BACE1 differentially affect APP processing. Using SH-SY5Y cells stably expressing APP695 or BACE1, cleavage of APP was analyzed by western blot and ultra-sensitive MSD assay. Representative western blots for the examination of APP, BACE1, sAPPβ, and sAPPtotal (a, b), and the corresponding quantification for the relative amounts of sAPPβ (c) and sAPPtotal (d). MSD multiplexing to quantify the absolute amounts of Aβ34 (e), Aβ38 (f), Aβ40 (g), and Aβ42 (h). Data were collected from four independent experiments. Bars and error bars indicate mean ± s.e.m. c–h Data were analyzed with one-way ANOVAs and Tukey’s post-hoc tests were performed for pairwise comparisons; selected comparisons are highlighted ***p < 0.001, *p < 0.05, ns = nonsignificant p > 0.05. c sAPPβ, F(2, 9) = 131.2, p < 0.0001, d sAPPtotal, F(2, 9) = 190.3, p < 0.0001, e Aβ34, F(2, 9) = 70.04, p < 0.0001, f Aβ38, F(2, 9) = 149.0, p < 0.0001, g Aβ40, F(2, 9) = 89.96, p < 0.0001, h Aβ42, F(2, 9) = 113.6, p < 0.0001
Fig. 4
Fig. 4
Surplus of APP or BACE1 affect BACE1 inhibition. Cleavage of APP was analyzed by western blot and ultra-sensitive MSD assays. Absolute or relative amounts of products were quantified from SH-SY5Y cells stably expressing APP695 (ad) or BACE1 (eh). Quantification of relative amounts of sAPPβ (a, e), and absolute amounts of Aβ34 (b, f), Aβ40 (c, g), and Aβ42 (d, h). Data were collected from four independent experiments. Bars and error bars indicate mean ± s.e.m. Tukey’s post-hoc tests were performed for pairwise comparisons; selected comparisons are highlighted ***p < 0.001, **p < 0.01, *p < 0.05. a sAPPβ, one-way ANOVA, F(2, 9) = 26.6, p < 0.001, b Aβ34, one-way ANOVA, F(2, 9) = 296.1, p < 0.0001, c Aβ40, one-way ANOVA, F(2, 9) = 65.9, p < 0.0001, d Aβ42, one-way ANOVA, F(2,9) = 59.4, p < 0.0001, e sAPPβ, one-way ANOVA, F(2, 9) = 25.4, p < 0.001, f Aβ34, one-way ANOVA, F(2,9) = 45.3, p < 0.0001, g Aβ40, one-wayANOVA, F(2, 9) = 30.8, p < 0.0001, h Aβ42, one-way ANOVA, F(2, 9) = 23.3, p < 0.001
Fig. 5
Fig. 5
Aβ34 degradation by PA-sensitive metalloproteases. Using SH-SY5Y cells stably expressing APP695 or BACE1, MSD multiplexing to quantify the absolute amounts of Aβ34 (a), Aβ38 (b), Aβ40 (c), and Aβ42 (d) was performed. Data were collected from four independent experiments. Bars and error bars indicate mean ± s.e.m. Data were analyzed with two-way ANOVAs and significant interactions were followed up with simple main effects @treatment. ***p < 0.001, ns = nonsignificant p > 0.05. a Aβ34, interaction F(2, 18) = 23.93, p < 0.0001, simple main effects @Mock F(1, 18) = 0.12, p > 0.05, @APP F(1, 18) = 97.02, p < 0.0001, @BACE1 F(1, 18) = 50.41, p < 0.0001, b Aβ38, interaction F(2, 18) = 63.26, p < 0.0001, simple main effects @Mock F(1, 18) = 0.002, p > 0.05, @APP F(1, 18) = 197.54, p < 0.0001, @BACE1 F(1, 18) = 0.39, p > 0.05, c Aβ40, interaction F(2, 18) = 25.54, p < 0.0001, simple main effects @Mock F(1, 18) = 0.03, p > 0.05, @APP F(1, 18) = 73.97, p < 0.0001, @BACE1 F(1, 18) = 0.34, p > 0.05, d Aβ42, interaction F(2, 18) = 29.08, p < 0.0001, simple main effects @Mock F(1, 18) = 0.07, p > 0.05, @APP F(1, 18) = 97.47, p < 0.0001, @BACE1 F(1, 18) = 0.67, p > 0.05. Schematic model (e) describes the proposed APP and Aβ processing pathways involving BACE1 and metalloproteases
Fig. 6
Fig. 6
Aβ34 and core biomarkers in the Amsterdam Dementia Cohort. ac Analyses of Aβ34 and Aβ42 in human CSF samples. n = 22 subjective complaints (SC), n = 17 MCI (stable), n = 27 MCI (converter), n = 32 Alzheimer’s disease (AD). Horizontal lines indicate mean ± s.e.m. The data were analyzed with one-way ANOVAs and Tukey’s post-hoc tests (***p < 0.001, *p < 0.05, ns p > 0.05). a Aβ34, one-way ANOVA F(3, 94) = 3.71, p < 0.05, b Aβ42, one-way ANOVA F(3, 94) = 30.91, p < 0.0001, c Aβ 34/Aβ42, one-way ANOVA F(3, 94) = 21.71, p < 0.0001. d Receiver operating characteristic (ROC) curves were computed on CSF levels of Aβ34, Aβ40, and Aβ42 in samples from the Amsterdam Dementia Cohort n = 17 MCI (stable), n = 27 MCI (converter). e ROC curves on Aβ40/Aβ42 and Aβ34/Aβ42 ratios from MCI (stable) and MCI (converter)). ROCs were compared using DeLong test: Aβ40/Aβ42 vs. Aβ34/Aβ42 (p = 0.0298). f ROC curves on p-tau and t-tau from MCI (stable) and MCI (converter)). g Comparison of the performance of various molecules measured in CSF, which is based on average MCI (converter) to MCI (stable) ratios in the Amsterdam Dementia Cohort. The MCI (converter) to MCI (stable) ratio of Aβ42 was inverted for better comparison with the other ratios
Fig. 7
Fig. 7
Aβ34, Aβ42, t-tau, and p-tau in PREVENT-AD. ae PREVENT-AD Study: analysis of Aβ34, Aβ42, t-tau, and p-tau in CSF samples from cognitively normal individuals at risk for Alzheimer’s disease (n = 94). a Individuals can be separated into stages of pre-symptomatic AD, based on CSF biomarker assessment (t-tau cut-off > 422 pg/mL,, Aβ42 cut-off ≤ 647 pg/mL, the gray shaded area indicates common inter-assay variances of the used cut-off values,). STAGE 0: t-tau and Aβ42 normal; STAGE1: t-tau normal and Aβ42 ≤ 647 pg/mL; STAGE 2: t-tau > 422 pg/mL, and Aβ42 ≤ 647 pg/mL; Suspected-non-AD pathology (SNAP): t-tau > 422 pg/mL and Aβ42 normal. Individuals with Aβ34/Aβ42 ratio above the optimal cut-off calculated in this study (Aβ34/Aβ42 > 0.245) are highlighted in magenta. be Comparison of age, Mann–Whitney U = 461.5, p = 0.0586 (b); Cardiovascular Risk Factors, Aging, and Incidence of Dementia (CAIDE), Mann–Whitney U = 184.5, p = 0.0004 (c); t-tau, unpaired t-test t(92) = 3.027, p = 0.0032 (d); and P181-tau (p-tau), unpaired t-test t(92) = 2.453, p = 0.0168 (e); between individuals with Aβ34/Aβ42 ratios above and below optimal cut-off (***p < 0.001, **p < 0.01, *p < 0.05, ns p > 0.05). Horizontal lines indicate mean ± s.e.m.
Fig. 8
Fig. 8
Association between CSF-Aβ34 and Aβ clearance rates. Analysis of Aβ34, Aβ38, Aβ40, and Aβ42 in human CSF with ultra-sensitive assays (Meso Scale Discovery (MSD)). Aβ38, Aβ40, and Aβ42 clearance (fractional turnover rate, FTR) was previously measured using stable isotope labeling kinetic (SILK). Samples were from n = 10 Aβ+ and n = 10 Aβ– individuals. Scatterplots of CSF-Aβ34 (ac), Aβ38 (df), Aβ40 (gi), or Aβ42 (jl) with Aβ38 FTR (a, d, g, j), Aβ40 FTR (b, e, h, k), or Aβ42 FTR (c, f, i, l). Pearson correlation coefficients (r) were computed to assess the relationship between the variables. The Bonferroni adjusted p-values are: **p < 0.003, *p < 0.016, ns = nonsignificant p > 0.0125
Fig. 9
Fig. 9
Conceptual model of early changes in AD. Before a clinical diagnosis of Alzheimer’s disease (AD), decades of Aβ peptide deposition lead to plaque formation in pre-symptomatic and prodromal stages of the disease. Incorporating Aβ34 (marker of enzymatic Aβ degradation) with measures of Aβ42 (marker for cerebral Aβ deposition) could complement current biomarker assessments and provide additional information about Aβ turnover

References

    1. Hardy J, Selkoe DJ. The amyloid hypothesis of Alzheimer’s disease: progress and problems on the road to therapeutics. Science. 2002;297:353–356. doi: 10.1126/science.1072994. - DOI - PubMed
    1. Walsh DM, Selkoe DJ. Oligomers on the brain: the emerging role of soluble protein aggregates in neurodegeneration. Protein Pept. Lett. 2004;11:213–228. doi: 10.2174/0929866043407174. - DOI - PubMed
    1. Wilquet V, De Strooper B. Amyloid-beta precursor protein processing in neurodegeneration. Curr. Opin. Neurobiol. 2004;14:582–588. doi: 10.1016/j.conb.2004.08.001. - DOI - PubMed
    1. Thinakaran G, Koo EH. Amyloid precursor protein trafficking, processing, and function. J. Biol. Chem. 2008;283:29615–29619. doi: 10.1074/jbc.R800019200. - DOI - PMC - PubMed
    1. Takami M, et al. gamma-Secretase: successive tripeptide and tetrapeptide release from the transmembrane domain of beta-carboxyl terminal fragment. J. Neurosci. 2009;29:13042–13052. doi: 10.1523/JNEUROSCI.2362-09.2009. - DOI - PMC - PubMed

Publication types

MeSH terms