

doi: 10.1038/s41592-019-0408-9.
Epub 2019 May 20.
A general method to quantify ligand-driven oligomerization from fluorescence-based images
Affiliations
- PMID: 31110281
- PMCID: PMC7617210
- DOI: 10.1038/s41592-019-0408-9
Item in Clipboard
A general method to quantify ligand-driven oligomerization from fluorescence-based images
Nat Methods.
2019 Jun.
Abstract
Here, we introduce fluorescence intensity fluctuation spectrometry for determining the identity, abundance and stability of protein oligomers. This approach was tested on monomers and oligomers of known sizes and was used to uncover the oligomeric states of the epidermal growth factor receptor and the secretin receptor in the presence and absence of their agonist ligands. This method is fast and is scalable for high-throughput screening of drugs targeting protein-protein interactions.
Conflict of interest statement
M.R.S., G.B., and V.R. have submitted a provisional patent application covering aspects related to the generation, analysis and applications of one and two-dimensional brightness spectrograms.
Figures
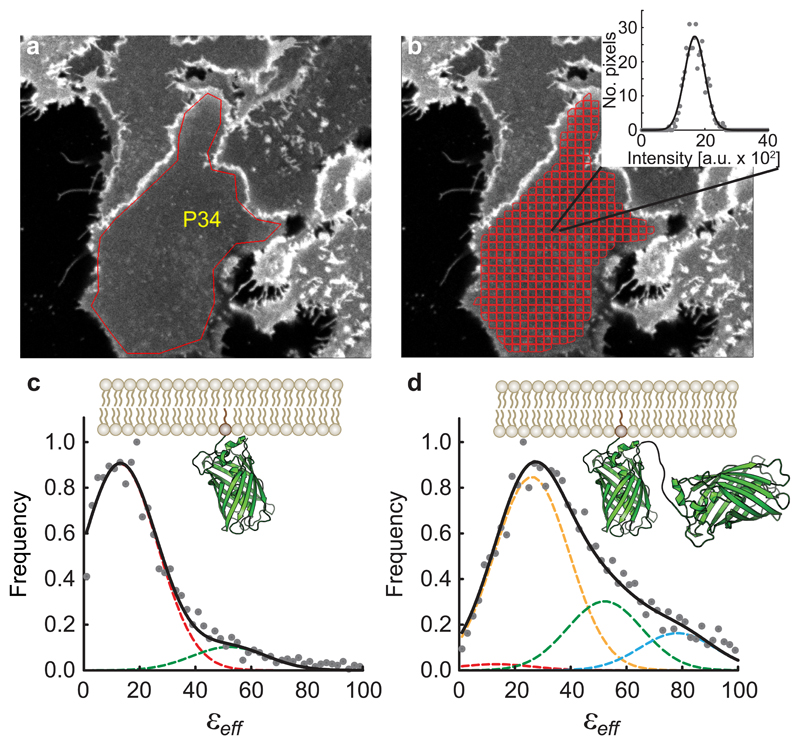
a, Typical fluorescence image of Flp-In™ T-REx™ 293 cells (out of 8 images containing 44 cells) expressing a plasma membrane-targeted mEGFP construct (PM-1-mEGFP). The overlaid polygon (P34) indicates a region of interest (ROI) comprising a patch of the basolateral membrane of a cell. b, Software-generated image segmentation of the ROI in (a) using the moving-squares method (see Methods). Inset, fluorescence intensity histogram (circles) of a single segment, together with its Gaussian curve fit (solid line). The mean and width of the Gaussian are used to calculate the brightness (εeff) and concentration for each segment (see Methods). c-d, Normalized frequency distribution assembled from (c) 3,582 and (d) 4,185 εeff values obtained from 8 images comprising several cells expressing monomeric (PM-1-mEGFP) or tandem (PM-2-mEGFP) mEGFP constructs was fit to a sum (solid black curves) of Gaussians (dashed lines with various colors), to find the brightness of single mEGFP protomers, Gaussian peak positions were set to where n is the number of protomers in an oligomer, and their widths were set equal to one another and determined from data fitting (13.4 a.u.). The εeff distribution for PM-1-mEGFP is primarily comprised of monomers (dashed, red Gaussian curve), with its peak positioned at while the PM-2-mEGFP spectrogram is mostly captured by a dimer model (dashed, yellow Gaussian curve), with its peak at
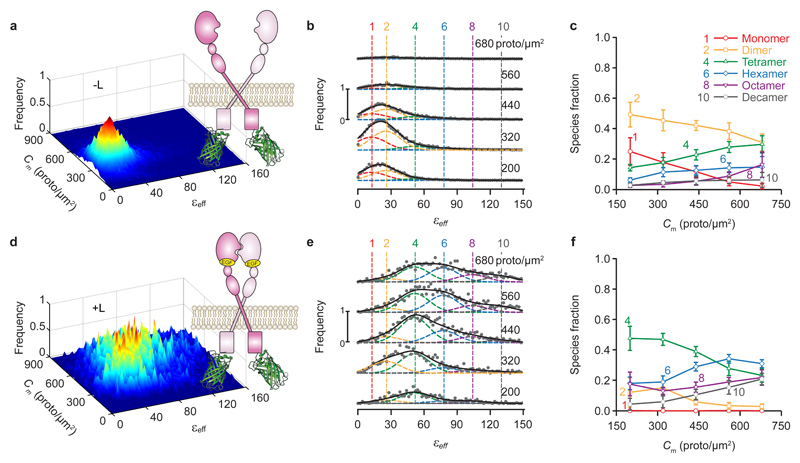
a,d, Frequency of occurrence of effective brightness (εeff) for each protomer concentration using (a) 25,740 and (d) 6,812 total ROI segments to construct the distribution, extracted from 48 and 26 images, respectively (each of which contain several cells). Data were collected from at least two separate experiments. b,e, Cross sections through the surface plots in panels a,d, respectively, for different total concentration ranges; average concentration for each range (in protomer/μm2) is indicated above each plot. The vertical dashed colored lines indicate the peak positions for the brightness spectra of monomers, dimers, tetramers, etc., obtained from (or predicted based on) the simultaneous fitting of the PM1- and PM2-mEGFP spectrograms in Fig. 1, which were used as standards of brightness in the analysis. The εeff distribution for each concentration range was fitted with a sum of six Gaussians; the peak of each Gaussian was set to where n is the number of protomers in a given oligomer (e.g., 1, 2, 4, etc.), with the εeff and standard deviation obtained from measurements on cells expressing PM-1-mEGFP or PM-2-mEGFP (Fig. 1). Only the Gaussian amplitudes (An) were adjusted in the process of data fitting in b,e which gave the fraction of protomers (c,f) for each oligomeric species, i.e., niAi/∑n
nAn. Number of Gaussians in each fit was chosen as discussed in the Methods section. c,f, Relative concentration of protomers in each oligomeric species vs. total protomer concentration, as derived by decomposing the spectrograms in column 2 into Gaussian components. Each data point and its error bar represent the mean ± standard deviation, respectively, of 1,500 different relative fraction values resulting from bootstrapping and refitting the original set of images as described in the Methods section.
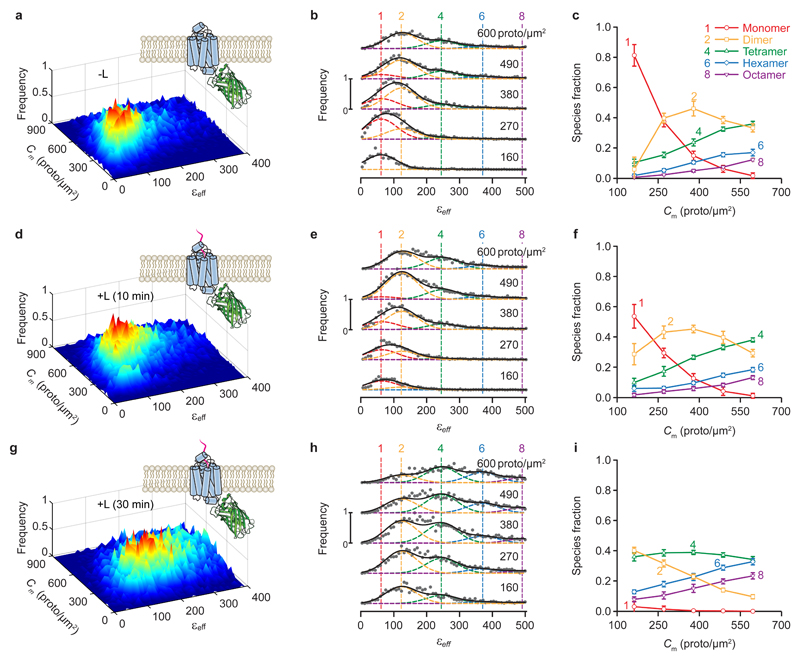
a,d,g, Surface plots of the frequency of occurrence of εeff for each concentration of protomers using (a) 13,420, (d) 15,309 and (g) 12,979 total segments to construct the distribution, extracted from 82, 80, and 82 images, respectively (each of which contain several cells). b,e,h, Stacks of cross sections through the surface plots in panels (a), (d), and (g), respectively, i.e., frequency of occurrence vs. effective brightness for different concentration ranges; average concentration for each range (in protomer/μm2) is indicated above each plot. The vertical dashed lines indicate the peak positions for the brightness spectra of monomers, dimers, etc., obtained from (or predicted by) the simultaneous fitting of the PM-1- and PM-2-mEGFP spectrograms used as standards of brightness (Supplementary Fig. 1). Number of Gaussians in each fit was chosen as described in the Methods section. c,f,i, Relative concentration of protomers within each oligomeric species vs. total concentration of protomers, as derived from unmixing of the curves in (b), (e), and (h), respectively, into different Gaussian components. Samples were as follows: wild-type secretin receptor treated with vehicle (-L) (first row of graphs), secretin (+L) for 10 minutes (second row of graphs), or secretin (+L) for 30 minutes (third row of graphs). Each data point and its error bar represent the mean ± standard deviation, respectively, of 1,500 different relative fraction values resulting from bootstrapping and refitting the original set of images as described in the Methods section. Entire data analysis process followed the steps described in the caption to Fig. 2.
Comment in
-
Spatial heterogeneity in molecular brightness.Nat Methods. 2020 Mar;17(3):273-275. doi: 10.1038/s41592-020-0732-0. Epub 2020 Feb 10. Nat Methods. 2020. PMID: 32042187 No abstract available.
-
Reply to: Spatial heterogeneity in molecular brightness.Nat Methods. 2020 Mar;17(3):276-278. doi: 10.1038/s41592-020-0735-x. Epub 2020 Feb 10. Nat Methods. 2020. PMID: 32042189 No abstract available.
References
-
- Panetta R, Greenwood MT. Physiological relevance of GPCR oligomerization and its impact on drug discovery. Drug Discov Today. 2008;13:1059–1066. - PubMed
Publication types
MeSH terms
Substances
Grants and funding
LinkOut - more resources
Full Text Sources
Research Materials
Miscellaneous
