. 2019 Jul;20(7):915-927.
doi: 10.1038/s41590-019-0386-1. Epub 2019 May 20.

Tubular cell and keratinocyte single-cell transcriptomics applied to lupus nephritis reveal type I IFN and fibrosis relevant pathways

Collaborators, Affiliations

Tubular cell and keratinocyte single-cell transcriptomics applied to lupus nephritis reveal type I IFN and fibrosis relevant pathways

Evan Der et al. Nat Immunol. 2019 Jul.

Erratum in

Abstract

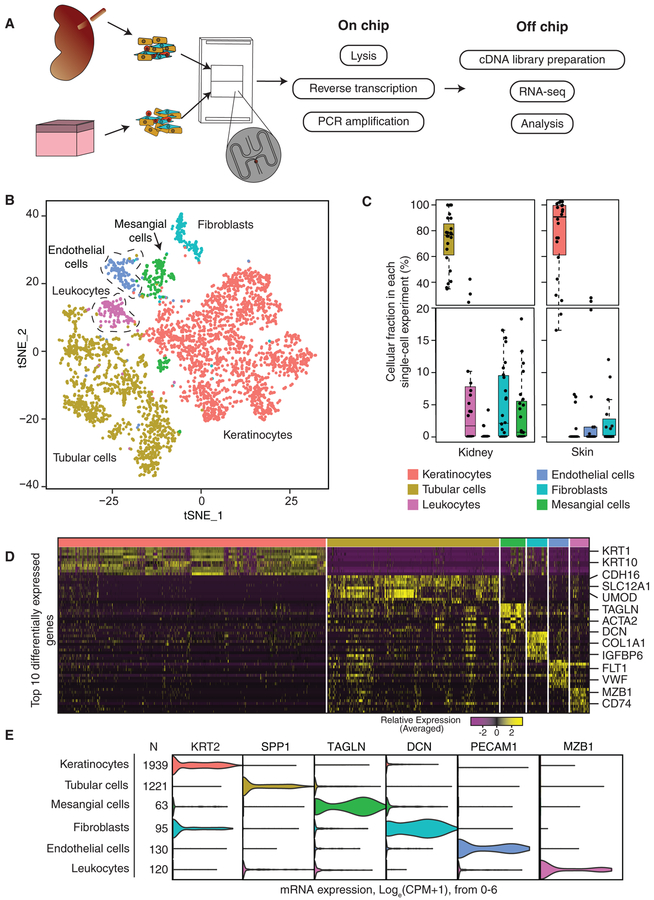
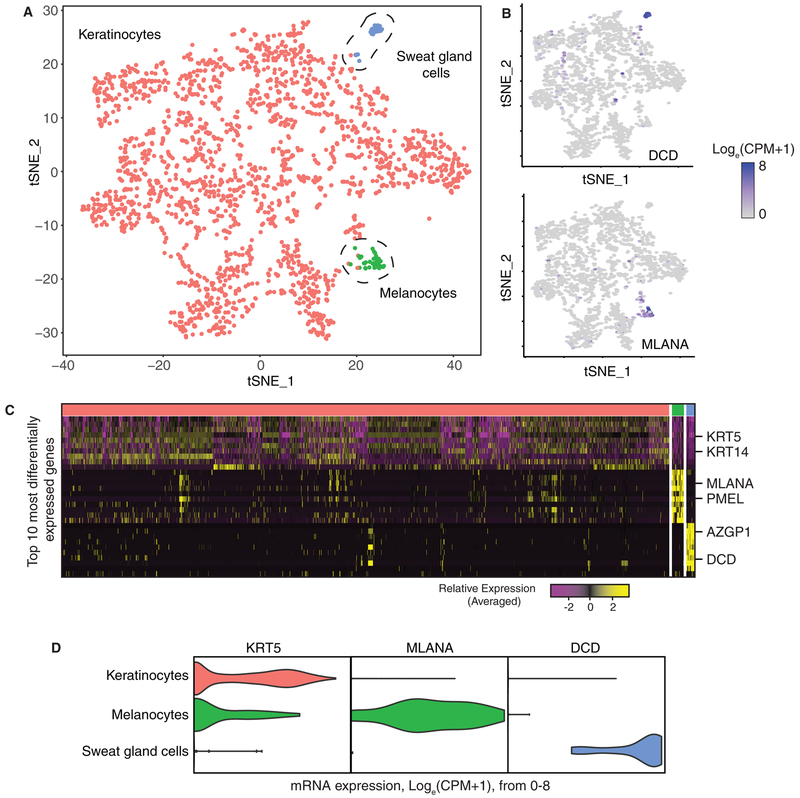
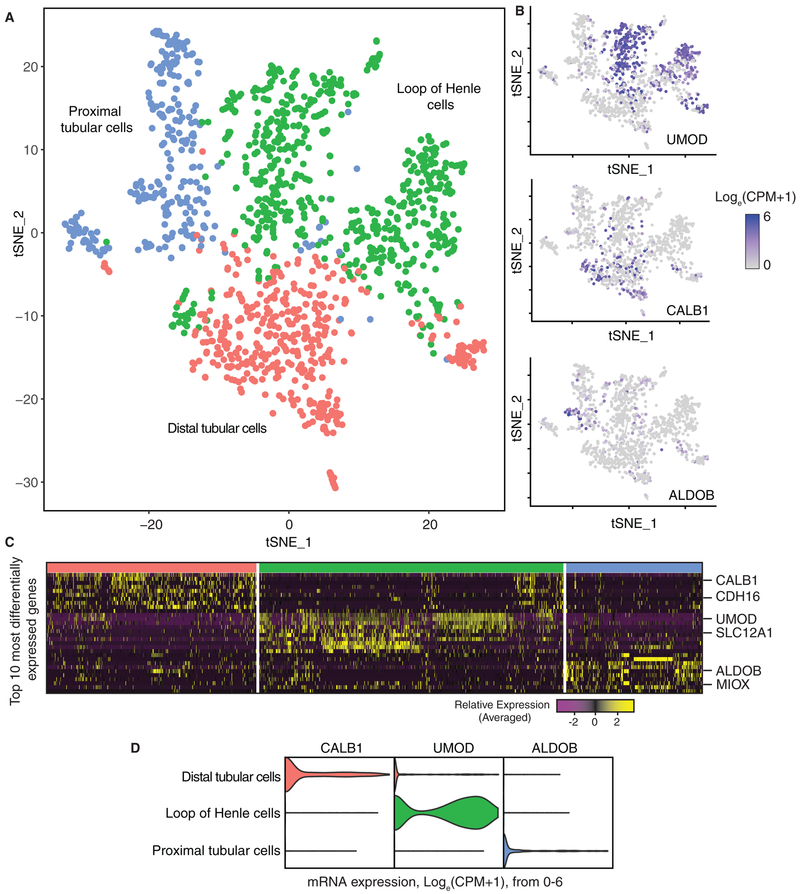
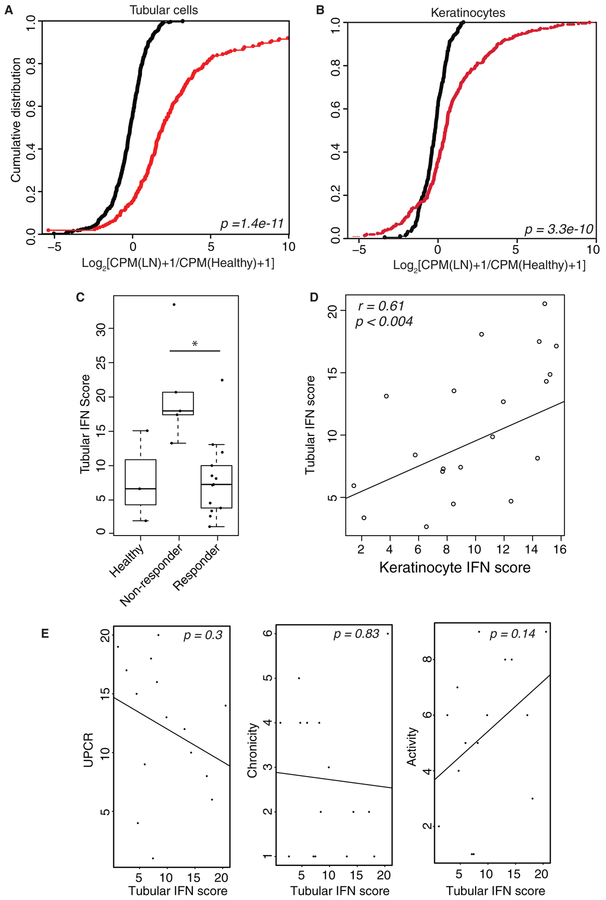
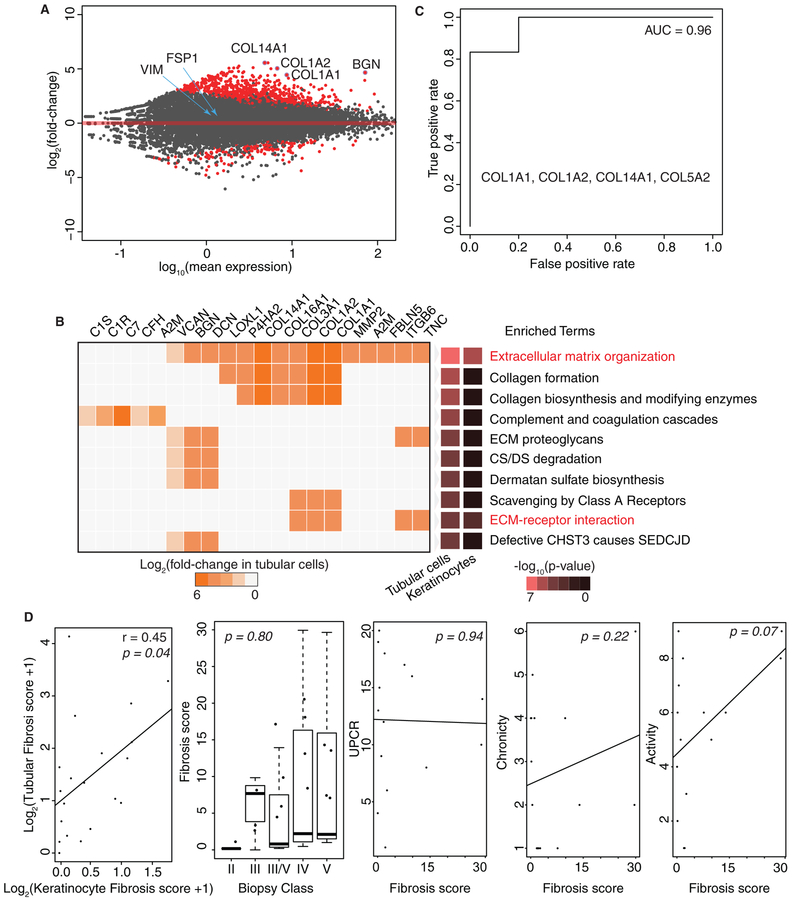
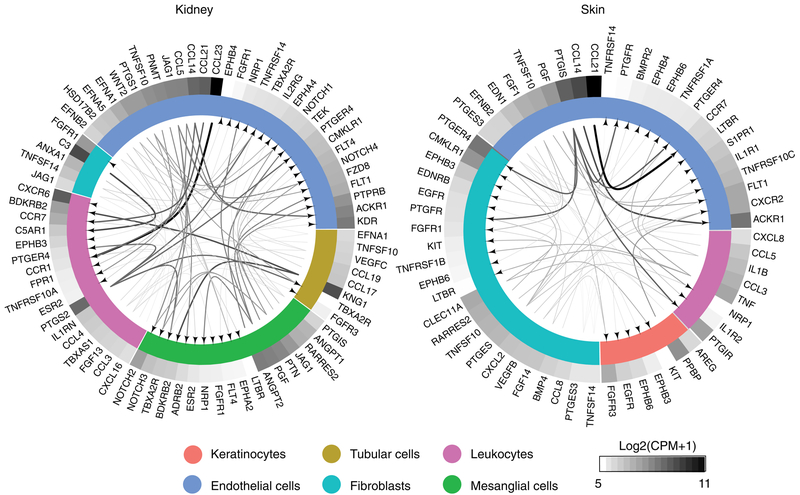
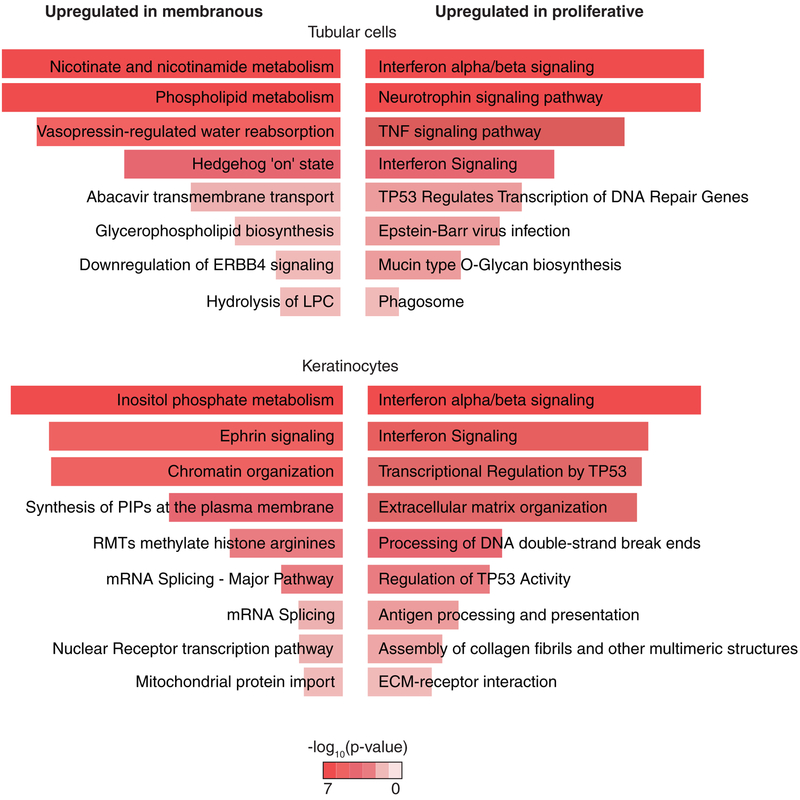
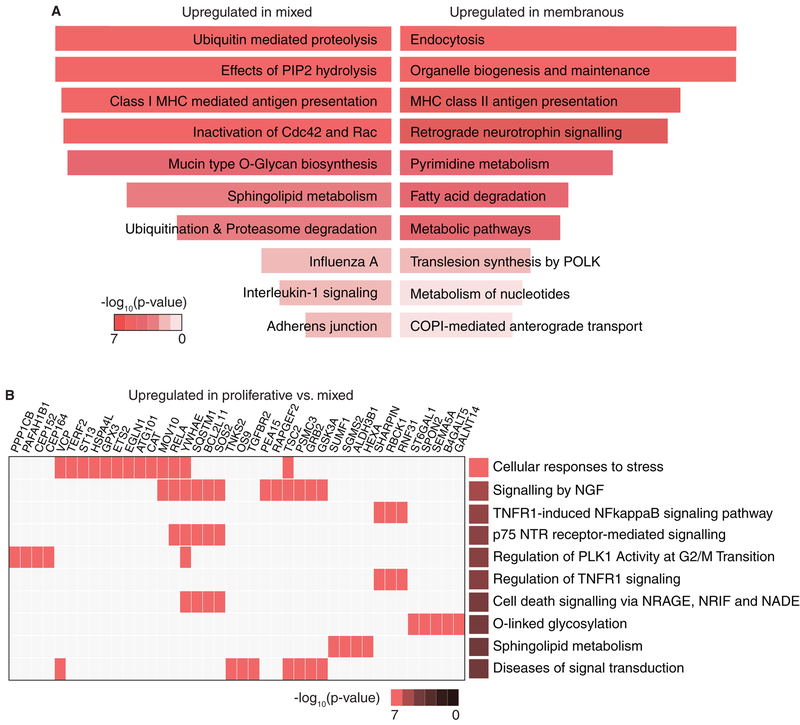
The molecular and cellular processes that lead to renal damage and to the heterogeneity of lupus nephritis (LN) are not well understood. We applied single-cell RNA sequencing (scRNA-seq) to renal biopsies from patients with LN and evaluated skin biopsies as a potential source of diagnostic and prognostic markers of renal disease. Type I interferon (IFN)-response signatures in tubular cells and keratinocytes distinguished patients with LN from healthy control subjects. Moreover, a high IFN-response signature and fibrotic signature in tubular cells were each associated with failure to respond to treatment. Analysis of tubular cells from patients with proliferative, membranous and mixed LN indicated pathways relevant to inflammation and fibrosis, which offer insight into their histologic differences. In summary, we applied scRNA-seq to LN to deconstruct its heterogeneity and identify novel targets for personalized approaches to therapy.


Conflict of interest statement

Competing interests

The authors declare no competing interests.

Figures

Figure 1.
Figure 1.. Cell lineage determination by dimensionality reduction analysis.
a. Schematic of the scRNA-seq pipeline. Skin (n = 17) and kidney (n = 21) samples from patients with LN or healthy control subjects (n = 3) were collected at the time of clinically indicated renal biopsy or live kidney donation, respectively. Skin and kidney biopsies were enzymatically disaggregated into single cell suspensions and loaded onto a microfluidic device. b. t-Distributed Stochastic Neighbor Embedding (tSNE) clustering of 4,019 single cells. PCA identified six major clusters of cells from both skin and kidney biopsies. Cells are color-coded by an algorithm for determining expression clusters and cell types. c. Box plot of the percent contribution of each cluster from skin and kidney biopsies. Boxes are colored by cluster corresponding to Fig. 1b. The boxes indicate the first quartile, median, and third quartile. Whiskers indicate the highest and lowest values. Points were drawn as outliers if they were more than 1.5 times the inter quartile range. d. Heatmap of the top 10 most differentially expressed genes in each cluster to identify mutually exclusive gene sets, which were then used to determine the cell lineage of each cluster. Each row is a differentially expressed gene and each column is a single-cell organized by cluster identity. Transcript abundance ranges from low (purple) to high (yellow). e. Violin plot of selected markers indicating the expression level of canonical markers within each cluster. Violin plots are colored by cell type and width represents the percent of cells expressing the marker at a given level in Loge(CPM+1) from 0 to 6.
Figure 2.
Figure 2.. Subclustering of keratinocytes reveals two rare skin-specific cell types.
a. tSNE plotting of 1,939 keratinocytes identified in initial clustering analysis colored by cluster identifying algorithm with cell type labels next to each cluster. b. Expression of DCD and MLANA, markers of the new clusters, within the tSNE plot (n = 1,939 cells) from low expression (grey) to high expression (dark blue). c. Heatmap of the differentially expressed genes between each identified cluster. d. Violin plot of MLANA and DCD, markers of melanocytes (n = 33) and sweat gland cells (n = 29), respectively. Violin plots are colored by cell type and width represents the percent of cells expressing the marker at a given level in Loge(CPM+1) from 0 to 8.
Figure 3.
Figure 3.. Subclustering of tubular cells identifies major tubular cell subtypes of the nephron.
a. tSNE plotting of 1,221 tubular cells identified by initial clustering analysis. Three clusters of tubular cells are identified and colored by clustering algorithm with labels of putative cluster identity indicated next to each cluster. b. Expression of established tubular subtype markers within the tSNE plot (n = 1,221 cells) from low expression (grey) to high expression (dark blue). c. Heatmap of the top 10 most differentially expressed genes between each cluster. d. Violin plots of UMOD, CALB1, and ALDOB which are canonical markers of Loop of Henle (n = 581), distal tubular (n = 394), and proximal tubular cells (n = 246), respectively. Violin plots are colored by cell type and width represents the percent of cells expressing the marker at a given level in Loge(CPM+1) from 0 to 6.
Figure 4.
Figure 4.. IFN response signature differentiates patients with LN from healthy control subjects and response to treatment.
a. Cumulative distribution function (CDF) of the ratio of expression of 212 IFN responsive genes (red line) or ubiquitously expressed genes (black line) in both tubular cells (n = 1,112 patient cells and n = 109 healthy control cells, p = 1.4e-11) and b. keratinocytes (n = 1,766 patient cells and n = 173 healthy control cells, p = 3.3e-10) compared using a two-tailed Wilcoxon signed rank test. c. Boxplot of IFN response scores in healthy control subjects (n =3), patients who responded to treatment (n = 13), and patients who did not respond to treatment (n = 5) compared with a two-tailed Student’s t-test (p = 0.0003, t = 4.7234). The boxes indicate the first quartile, median, and third quartile. Whiskers indicate the highest and lowest values. Points were drawn as outliers if they were more than 1.5 times the inter quartile range. d. Pearson’s correlation between tubular and keratinocyte IFN response scores per patient (n = 20, r = 0.61, p =0.004). e. Pearson’s correlations between IFN response scores and UPCR (p = 0.3), Chronicity (p = 0.83), and Activity indices (p = 0.14).
Figure 5.
Figure 5.. A fibrotic gene signature as a potential prognostic marker for patients non-responsive to treatment.
a. MA plot of differential expression analysis performed between tubular cells of patients responsive (n = 13) or non-responsive to treatment (n = 5). Significantly differentially expressed genes determined by the Wald test corrected for multiple comparisons. are colored in red. b. Pathway enrichment analysis of genes identified as upregulated in patients non-responsive to treatment (n = 13) in Figure 5A. -Log10(p-value) determined by gene ontology fuzzy-enrichment analysis of each pathway is shown for both keratinocytes and tubular cells colored from least significant (black) to most significant (red). Log2 fold change in gene expression between patients non-responsive to treatment (n = 13) compared with patients responsive to treatment (n = 5) in each pathway are indicated for tubular cells from smallest (grey) to highest (orange). c. Receiver operating characteristic curve of the logistic regression equation of differentially expressed fibrotic genes, COL1A2, COL1A1, COL14A1, COL5A2, with area under the curve (AUC) indicated (n = 18 patients). d. Pearson’s Correlations between the log2 transformed tubular and keratinocyte fibrosis scores (n = 20, r = 0.45, p = 0.04), the tubular fibrosis score by biopsy class (p = 0.80, F = 0.334), and between tubular fibrosis scores and UPCR (p = 0.94), Chronicity (p = 0.22), and Activity indices (p = 0.07). The boxes indicate the first quartile, median, and third quartile. Whiskers indicate the highest and lowest values.
Figure 6.
Figure 6.. Putative receptor-ligand interactions between kidney and skin cells.
Lines represent interactions between cell types in the skin and the kidney, and are shaded according to the ligand expression as detailed in the scale bar. Lines originate at the ligand and connect to its receptor as indicated by the arrowhead. Each cell type is color coded and represented by that color in each organ. Only the top expressed receptors and ligands with expression above 45 CPM and 65 CPM, respectively, within each cell type are shown. Receptors and ligand are arranged by expression strength clockwise from lowest expression to highest. Ligands or receptors without a cognate pair were excluded from visualization. Only patients with LN (n = 18) were included in this analysis.
Figure 7.
Figure 7.. Differential expression and pathway enrichment analysis of tubular cells and keratinocytes between membranous and proliferative LN.
Significantly enriched pathways in both tubular cells and keratinocytes in membranous (n = 6) and proliferative (n = 8) LN are indicated. Mixed class III/V or IV/V were excluded from this analysis. Color intensity and length of bar indicates higher-Log10(p-value) determined by gene ontology fuzzy-enrichment analysis from least significant (white) to most significant (red).
Figure 8.
Figure 8.. Differential expression and pathway enrichment analysis of tubular cells between membranous or proliferative LN and mixed class disease.
a. Differential expression analysis and pathway enrichment of mixed class nephritis (class III/V and class IV/V, n = 5) vs. membranous (class V, n = 6). Color intensity and length of the bar indicate higher-Log10(p-value) determined using gene ontology fuzzy-enrichment analysis from least significant (white) to most significant (red). b. Upregulated pathways and genes in proliferative nephritis (class III and class IV, n = 8) vs. mixed class nephritis. -Log10(p-value) determined using gene ontology fuzzy-enrichment analysis of each pathway is shown and colored from least significant (black) to most significant (red).

Comment in

Similar articles

Cited by

References

    1. Tsokos GC Systemic Lupus Erythematosus. N. Engl. J. Med 365, 2110–2121 (2011). - PubMed
    1. Mohan C & Putterman C Genetics and pathogenesis of systemic lupus erythematosus and lupus nephritis. Nat. Rev. Nephrol 11, 329–341 (2015). - PubMed
    1. Weening JJ et al. The classification of glomerulonephritis in systemic lupus erythematosus revisited. J. Am. Soc. Nephrol. JASN 15, 241–250 (2004). - PubMed
    1. Yu F et al. Tubulointerstitial lesions of patients with lupus nephritis classified by the 2003 International Society of Nephrology and Renal Pathology Society system. Kidney Int. 77, 820–829 (2010). - PubMed
    1. Hsieh C et al. Predicting outcomes of lupus nephritis with tubulointerstitial inflammation and scarring. Arthritis Care Res. 63, 865–874 (2011). - PMC - PubMed

Publication types

MeSH terms

Substances