. 2019 Jun;25(6):977-987.
doi: 10.1038/s41591-019-0441-3. Epub 2019 May 20.

IFN-γ-independent immune markers of Mycobacterium tuberculosis exposure

Affiliations

IFN-γ-independent immune markers of Mycobacterium tuberculosis exposure

Lenette L Lu et al. Nat Med. 2019 Jun.

Erratum in

Abstract

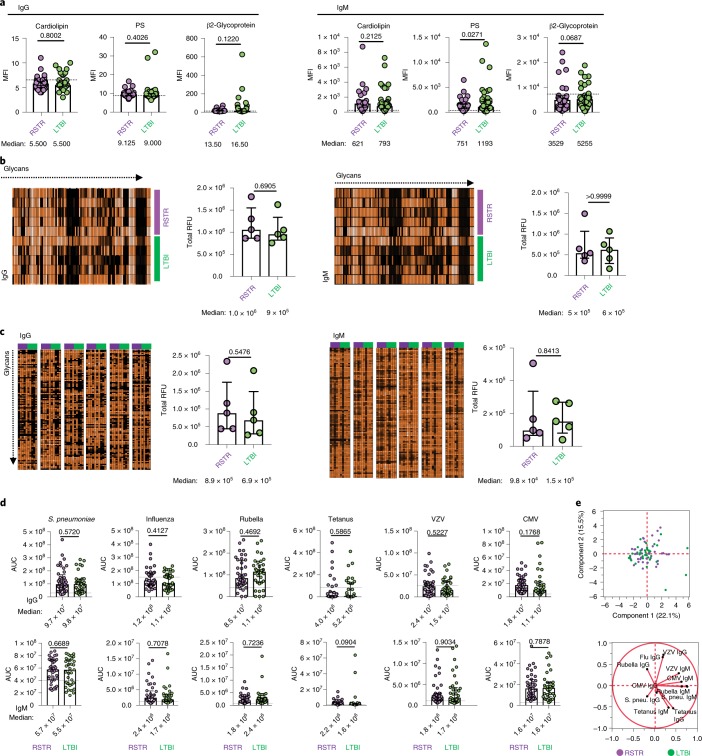
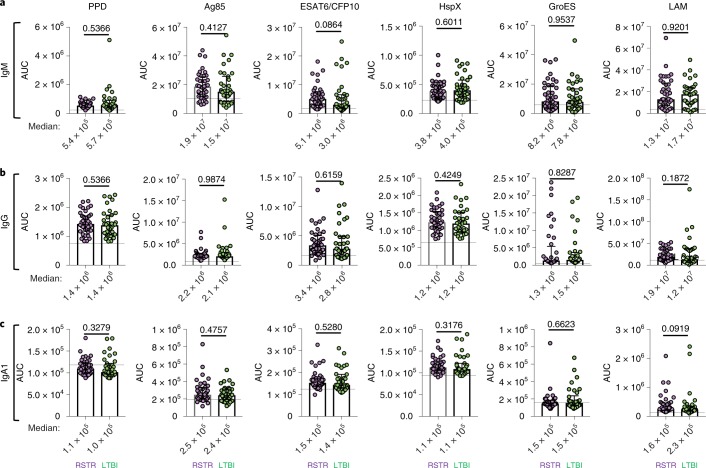
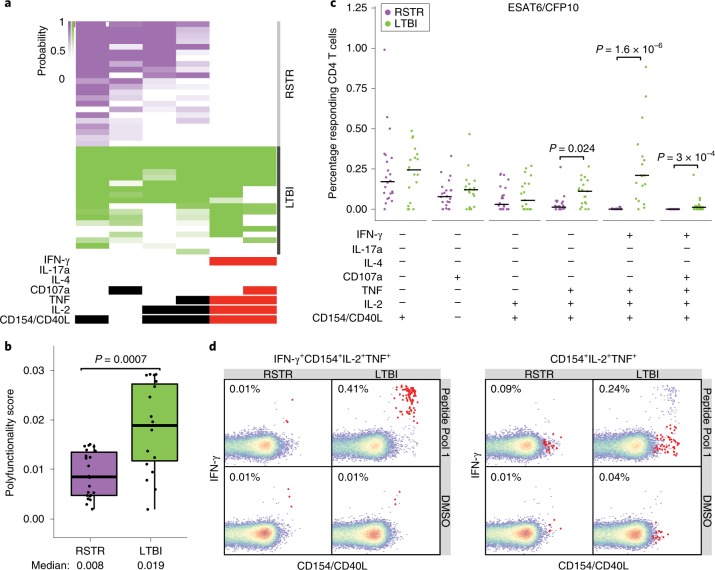
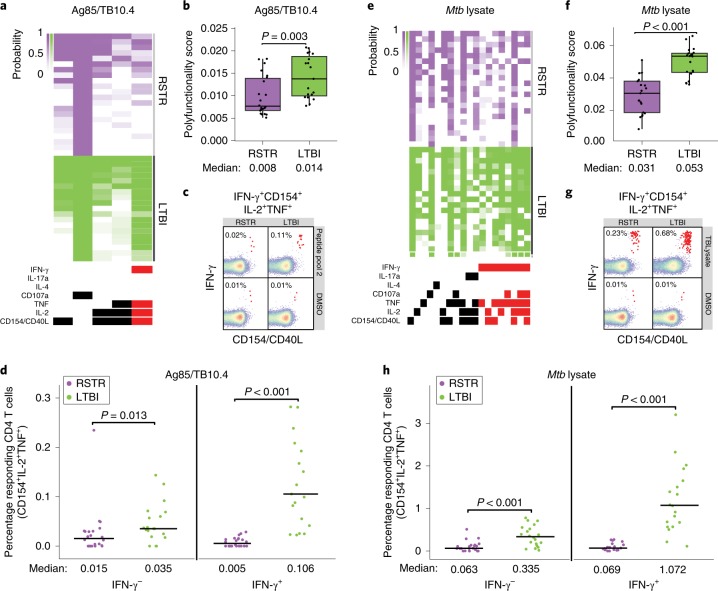
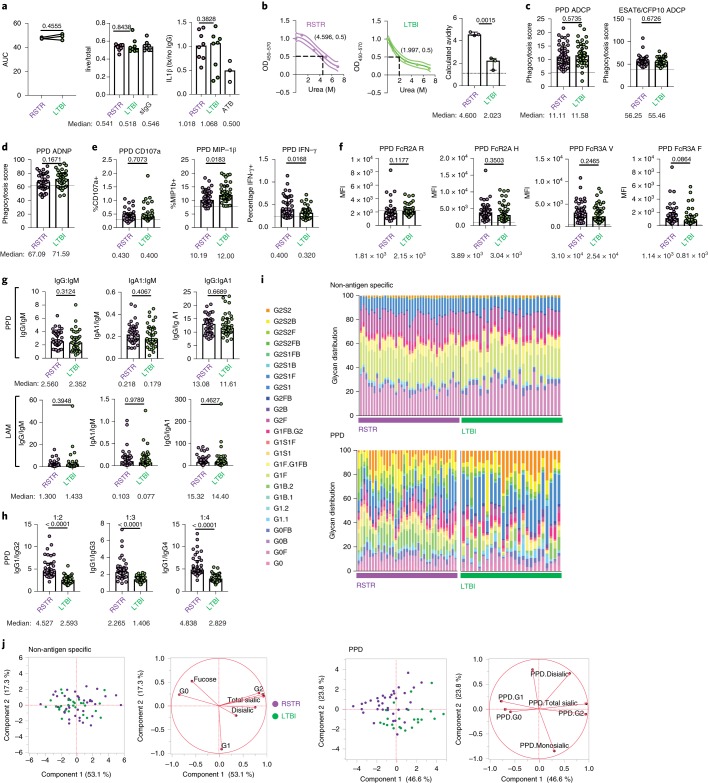
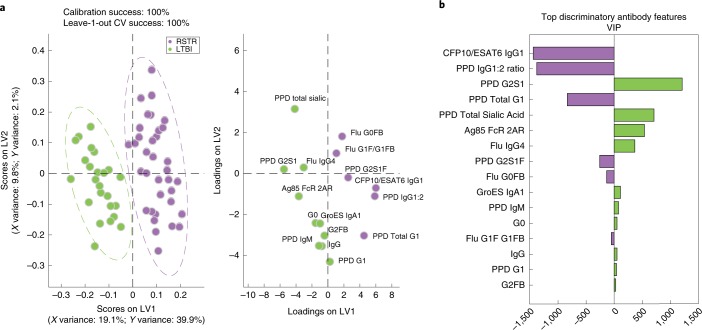
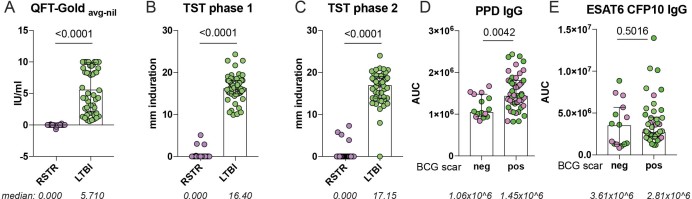
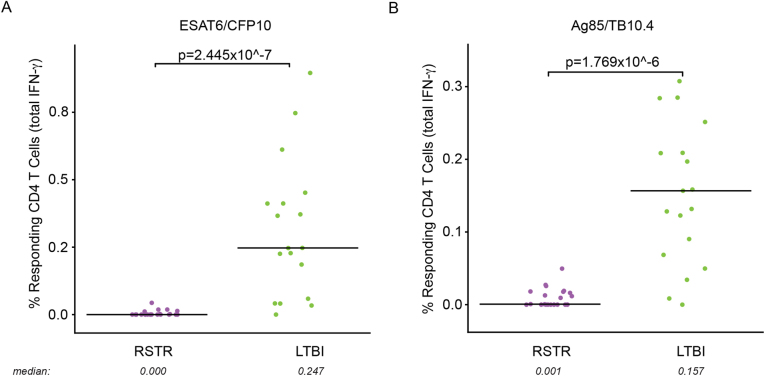
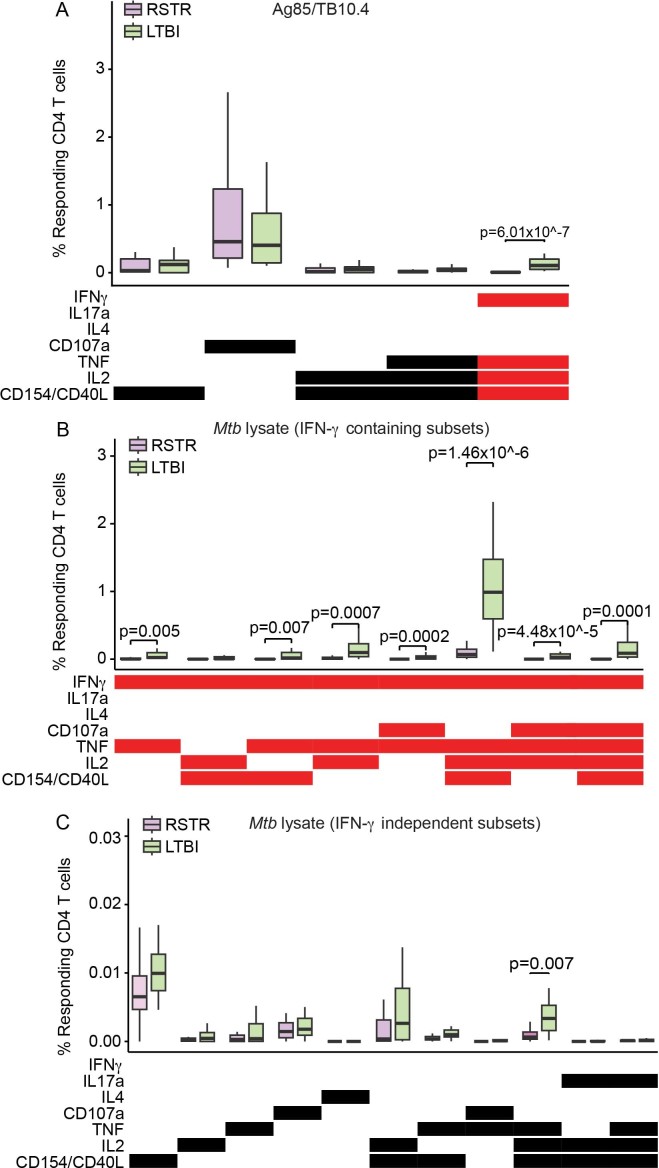
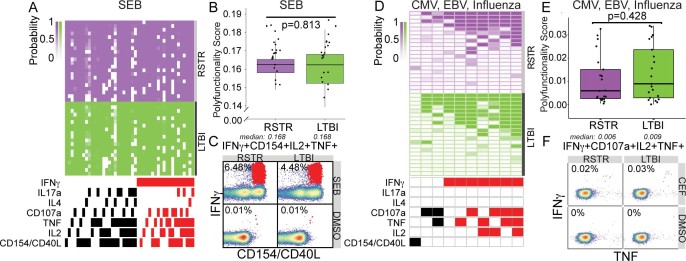
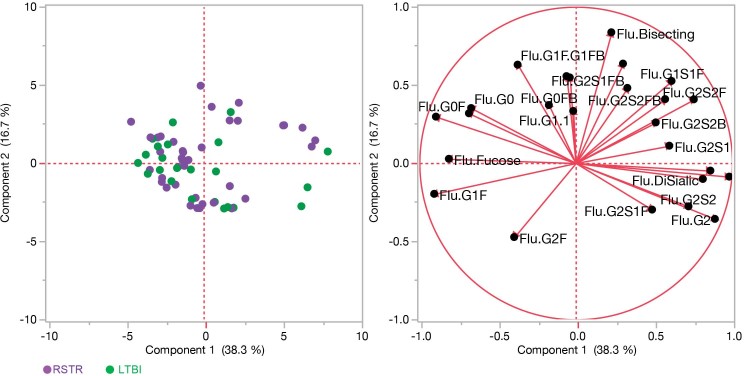
Exposure to Mycobacterium tuberculosis (Mtb) results in heterogeneous clinical outcomes including primary progressive tuberculosis and latent Mtb infection (LTBI). Mtb infection is identified using the tuberculin skin test and interferon-γ (IFN-γ) release assay IGRA, and a positive result may prompt chemoprophylaxis to prevent progression to tuberculosis. In the present study, we report on a cohort of Ugandan individuals who were household contacts of patients with TB. These individuals were highly exposed to Mtb but tested negative disease by IFN-γ release assay and tuberculin skin test, 'resisting' development of classic LTBI. We show that 'resisters' possess IgM, class-switched IgG antibody responses and non-IFN-γ T cell responses to the Mtb-specific proteins ESAT6 and CFP10, immunologic evidence of exposure to Mtb. Compared to subjects with classic LTBI, 'resisters' display enhanced antibody avidity and distinct Mtb-specific IgG Fc profiles. These data reveal a distinctive adaptive immune profile among Mtb-exposed subjects, supporting an expanded definition of the host response to Mtb exposure, with implications for public health and the design of clinical trials.


Conflict of interest statement

The authors declare no competing interests.

Figures

Fig. 1
Fig. 1. Comparable antibody reactivity to natural, glycan and common pathogens in ‘resisters’ and LTBI controls.
a, Plasma levels of IgG and IgM reactive to the common natural antigens cardiolipin, phosphatidylserine (PS) and β2-glycoprotein were profiled across ‘resisters’ (RSTR) (n = 40) and LTBI individuals (n = 39), represented by MFI using a customized Luminex with medians and interquartile ranges depicted for each group. b,c, Plasma IgG and IgM reactivity to 700 glycans in age- and sex-matched ‘resisters’ (n = 5) and LTBI individuals (n = 5) were determined on the NCFGv1 glycan microarray (b) and the CFG mammalian-type glycan microarray CFGv5 (c). Total fluorescence intensities depicted in heatmaps were determined per individual (rows in b and columns in c) and plotted in dot plots as relative fluorescence units (RFU), with medians and interquartile ranges depicted for each group. d, Plasma levels of IgG and IgM reactive to Streptococcus pneumoniae capsular polysaccharides (S. pneu.), a mixture of influenza HA, rubella virus, tetanus toxoid, VZV and CMV pp65 in ‘resisters’ (n = 40) and LTBI individuals (n = 39), were determined using customized multiplex Luminex. AUCs were determined from MFIs generated by three dilutions and plotted for each individual with medians and interquartile ranges depicted for each group. For ad, statistical significance was calculated using the Mann–Whitney U test, and two-tailed P values are indicated. Dotted lines represent the median level detected in HIV-negative, healthy North American volunteers. e, Principal component analysis using the IgG and IgM data generated in d demonstrates overlapping dot plots of microbial-reactive antibody profiles in ‘resisters’ (n = 40) and LTBI individuals (n = 39). The loadings plot and PLSDA plot are mirror images. Thus, the geographic location of the 12 antibody features on the loadings plot reflects the subject’s group in which a particular feature is enriched.
Fig. 2
Fig. 2. Detectable Mtb-specific humoral immunity in ‘resisters’.
ac, Plasma levels of IgM (a), IgG (b) and IgA1 (c) reactive to PPD, Ag85A, ESAT6 and CFP10, α-crystalline (HspX), GroES and LAM were quantified in ‘resisters’ (n = 40) and LTBI individuals (n = 39) with AUCs determined from MFIs generated using a customized Luminex assay, generated with three dilutions and plotted for each individual with medians and interquartile ranges depicted for each group. The statistical significance was calculated using the Mann–Whitney U test, and two-tailed P values are indicated. Dotted lines represent the median level detected in HIV-negative, healthy North American volunteers.
Fig. 3
Fig. 3. ‘Resisters’ display IFN-γ-independent T cell responses to Mtb-specific protein antigens.
a, ICS data generated using Mtb-specific proteins ESAT6 and CFP10 (Peptide Pool 1) were analyzed using COMPASS, and the results from six functionally relevant T cell subsets are displayed as a heatmap of the probability of detecting a response above background. Subsets containing IFN-γ are noted in red. Rows represent study subjects and the columns represent CD4 T cell functional subsets. b, Subject-specific COMPASS results were summarized for 41 individuals using the polyfunctionality score, which weights T cell subsets that include more than one function. Medians and interquartile ranges are depicted. The statistical significance was calculated using the Mann–Whitney U test, and the two-tailed P value is indicated. c, The absolute magnitude of responding CD4 T cells after background correction is displayed for each of the functional subsets identified by COMPASS. Individual data points for n = 41 (22 ‘resisters’, 19 LTBI controls) are shown with bars indicating medians. To facilitate visualization, we have not displayed a single LTBI outlier with a value of 3.12%. Statistical testing was performed using the Mann–Whitney U test, with correction for multiple hypothesis testing using Bonferroni’s method, and two-tailed P values are depicted. d, Representative flow cytometry plots from a ‘resister’ and a control subject examining an IFN-γ-containing or an IFN-γ-lacking T cell subset in response to stimulation with DMSO or Peptide Pool 1, with each experiment performed once. Frequencies of the relevant T cells are shown and indicated as red dots in the typical two-dimensional layout.
Fig. 4
Fig. 4. ‘Resisters’ have decreased T cell responses to common mycobacterial antigens.
a, COMPASS analysis identified five functionally relevant CD4 T cell subset responses to Peptide Pool 2 (Ag85A, Ag85B and TB10.4), which are summarized in the heatmap. Rows represent study subjects and columns CD4 T cell functional subsets. The depth of shading within the heatmap represents the probability of detecting a response above background. IFN-γ-containing subsets are noted in red. b, Subject-specific COMPASS results in response to stimulation with Peptide Pool 2 were summarized using the polyfunctionality score, which weights T cell subsets that include more than one function. The total number of subjects analyzed was 41. Boxplots show median and interquartile ranges. The statistical significance was calculated using the Mann–Whitney U test, and the two-tailed P value is indicated. c, Representative flow cytometry plots from a ‘resister’ and an LTBI subject show frequencies of IFN-γ+CD40L/CD154+IL-2+TNF+ T cells (red dots) in response to stimulation with Peptide Pool 2 or DMSO, with each experiment performed once. d, The absolute magnitude of Ag85/TB10.4-specific polyfunctional CD40L/CD154+ IL-2+ TNF+ CD4 T cells after background correction is displayed stratified by the expression of IFN-γ. These functional subsets represent the two right columns of the COMPASS plot in a. To facilitate visualization, we have not displayed a single LTBI outlier with the value of 3.41%. The total number of subjects analyzed was 41. Lines identify medians. The statistical significance was calculated using the Mann–Whitney U test, and two-tailed P values are indicated. e, COMPASS analysis identified 19 functionally relevant CD4 T cell subset responses to Mtb lysate, which are summarized in the heatmap. IFN-γ-containing subsets are noted in red. f, Polyfunctionality scores for the 41 subjects in response to Mtb lysate stimulation are shown, with boxplots representing median and interquartile ranges. The statistical significance was calculated using the Mann–Whitney U test, and the two-tailed P value is shown. g, Representative flow cytometry plots from a ‘resister’ and TST/IGRA-positive subject showing frequencies of IFN-γ+CD40L+IL-2+TNF+ T cells (red dots) in response to stimulation with Mtb lysate or DMSO are shown with each experiment performed once. h, The absolute magnitude of Mtb lysate-specific polyfunctional CD154+IL-2+TNF+ CD4 T cells after background correction is displayed, stratified by the expression of IFN-γ for 40 subjects, with lines representing medians. These functional subsets represent the 9th and 17th columns of the COMPASS plot in e. To facilitate visualization, we have not displayed a single LTBI outlier with a value of 12.61%. The statistical significance was calculated using the Mann–Whitney U test, and unadjusted two-tailed P values are shown.
Fig. 5
Fig. 5. Qualitatively distinct PPD-specific antibody responses in ‘resisters’ compared with LTBI individuals.
a, Graphs depict the AUCs calculated from the ratio of live to total intracellular bacterial burden in primary human monocyte-derived macrophages after treatment with purified IgG at 0.1 mg ml–1, 0.01 mg ml–1 and 0.001 mg ml–1 (left) from ‘resisters’ (n = 40) and TST/IGRA-positive LTBI controls (n = 39). Extension of analysis to additional donors was performed at a single concentration of purified IgG of 0.1 mg ml–1 due to sample availability (middle). Levels of secreted IL-1β from supernatants were measured by ELISA and are shown relative to no antibody treatment. Purified IgG from individuals in this study, with culture-confirmed pulmonary TB (ATB), is shown as a benchmark. Each line represents one healthy macrophage donor individual. For dot plots, lines are medians. The statistical significance was calculated using Wilcoxon’s matched-pairs signed rank, and two-tailed P values are shown. b, The calculated avidity against PPD from pooled plasma from ‘resisters’ (n = 40), TST/IGRA-positive LTBI controls (n = 39) and healthy, HIV-uninfected North Americans (n = 10) are shown, with lines representing the fitted curves and dotted lines the 95% confidence intervals. Each plasma group was tested in triplicate, with associated calculated avidity represented in the dot plot. The statistical significance was calculated using the Student’s t-test, and a two-tailed P value is indicated. OD, optical density or absorbance. ce, Plasma from ‘resisters’ (n = 40) and LTBI controls (n = 39) was assayed for the ability to mediate: PPD and ESAT6/CFP10-specific, antibody-dependent, monocyte-mediated cellular phagocytosis (c); PPD-specific, antibody-dependent neutrophil phagocytosis (d); and PPD-specific, NK cell activation by CD107a expression, macrophage inflammatory protein-1β and IFN-γ production (e). Data are representative of experiments performed in duplicate over three dilutions. Assays utilizing primary human neutrophils (d) and NK cells (e) were additionally performed utilizing three independent, healthy, HIV-negative donors. f, Affinity for FcγR2A(R), FcγR2A(H), FcγR3A(V) and FcγR3A(F) were determined using customized Luminex to PPD in ‘resisters’ (n = 40) and LTBI individuals (n = 39), using plasma diluted at 1:100. MFI is shown on the graph. The statistical significance was calculated using the Mann–Whitney U test, and P values are indicated. Dotted lines represent the median level detected in HIV-negative, healthy North American volunteers. g, Ratios of plasma levels of IgM, IgG and IgA1 reactive to PPD and LAM in ‘resisters’ (n = 40) and TST/IGRA-positive LTBI controls (n = 39) are depicted with medians and interquartile ranges. The statistical significance was calculated using the Mann–Whitney U test, and two-tailed P values are indicated. h, Ratios of plasma levels of IgG1, IgG2, IgG3 and IgG4 reactive to PPD in ‘resisters’ (n = 40) and TST/IGRA-positive LTBI individuals (n = 39) were measured by customized multiplex Luminex in serial dilutions. AUCs are depicted with medians and interquartile ranges. The statistical significance was calculated using the Mann–Whitney U test, and two-tailed P values are indicated. i, The relative distribution of glycoform substructures isolated from non-antigen-specific and PPD-specific IgG are depicted, with each column representing each individual. j, Principal component analysis demonstrates the overlapping profiles of ‘resisters’ (n = 40) and TST/IGRA-positive LTBI individuals (n = 39) in the dominant total glycans isolated from non-antigen-specific IgG compared with partially separating profiles from PPD-specific IgG. ADCP, antibody-dependent cellular phagocytosis; ADNP, antibody-dependent neutrophil phagocytosis; MIP, macrophage inflammatory protein.
Fig. 6
Fig. 6. Mtb-specific Fc profiles segregate ‘resisters’ and LTBI controls.
PLSDA was performed utilizing antigen-specific antibody levels, Fc effector functions and IgG glycosylation (total number of initial features = 216). a, The scores plot (left) shows the IFN-γ-negative and IFN-γ-positive profiles for each individual (dots). b, The loadings plot (right in a) shows that 16 antibody features separated each group with 100% calibration and 100% tenfold cross-validation accuracy. LV1 captures 19.1% of the X variance and 39.9% of the Y variance. Discriminatory features are depicted in a variable importance plot using the projection (VIP) scores that represent the weight of the selected variables in contributing to the overall separation between the groups (b) with features associated with ‘resisters’ to the left and IGRA/TST-positive LTBI individuals to the right.
Extended Data Fig. 1
Extended Data Fig. 1. Stratification of ‘resisters’ and LTBI controls by IGRA, TST and BCG scar.
ac, IGRA results (a) are shown by the average of three sequential QFT-Gold readings minus the background (nil) stratified across RSTR (n = 40) or LTBI (n = 39). TST results, stratified across RSTR or LTBI, are reported in mM of induration measured in phase 1 (b) and phase 2 (c) of the clinical trial. Medians are depicted by lines with interquartile ranges. d,e, Plasma levels of IgG reactive to PPD (d) and ESAT6 and CFP10 (e) were quantified in RSTR (n = 40) and LTBI (n = 39) individuals using a customized multiplex Luminex in serial dilutions. AUCs were determined from MFIs generated with each dilution and plotted for each individual. Data points are stratified by BCG scar status. Statistical significance was calculated by Mann–Whitney U test and two-tailed P values are indicated.
Extended Data Fig. 2
Extended Data Fig. 2. Analysis of total IFN-γ production by CD4 T cells after stimulation with peptide pools.
a,b, Aggregate IFN-γ-positive events, irrespective of the production of other cytokines, in response to stimulation with ESAT6/CFP10 (a) or Ag85/TB10.4 (b) are plotted. Individual data points for n = 41 are displayed after background correction, stratified by cohort assignment (RSTR or LTBI) with medians represented by lines. To facilitate visualization, we have not displayed a single LTBI outlier with value 3.41 and 4.25% in a and b, respectively. Statistical testing was performed on all the data points using Mann–Whitney U test and unadjusted two-tailed P values are shown.
Extended Data Fig. 3
Extended Data Fig. 3. Frequencies of CD4 T cell functional subsets identified by COMPASS after stimulation with Ag85/TB10.4 and Mtb lysate.
a, Absolute magnitude after background correction of CD4 T cell functional subsets identified by COMPASS in Fig. 4a upon stimulation with Ag85/TB10.4 are shown for RSTRs (n = 22) and LTBI (n = 19). b,c, For CD4 T cell subsets identified by COMPASS after Mtb lysate stimulation in Fig. 4e, absolute magnitude after background correction is shown for IFN-γ-containing (b) or IFN-γ-independent (c) T cell subsets. Boxplots show median, 25th and 75th percentile of the distribution and whiskers depict the range without outliers. IFN-γ-containing subsets are noted in red. Statistical testing was performed on all the data points using Mann–Whitney U test with correction for multiple hypothesis testing using the Bonferroni method and two-tailed P values are shown.
Extended Data Fig. 4
Extended Data Fig. 4. ‘Resisters’ are not globally deficient in IFN-γ production by T cells.
a, The COMPASS heatmap shows 49 informative CD4 T cell subset responses to staphylococcus enterotoxin B (SEB) for n = 42 individuals. Rows represent study subjects and columns represent CD4 T cell functional subsets. The depth of shading within the heatmap represents the probability of detecting a response to a given subset in a given subject above background. IFN-γ-containing subsets are noted in red. b, Subject-specific COMPASS results in response to SEB stimulation were summarized using a polyfunctionality score, which weights T cell subsets that include more than one function. Boxplots show median and interquartile range. Statistical significance was calculated by Mann–Whitney U test and the two-tailed P value is shown. c, Representative flow cytometry plots from a ‘resister’ and LTBI subject show frequencies of CD154+IFN-γ+IL-2+TNF+ T cells (red dots) in response to stimulation with SEB or DMSO, with each experiment performed once. d, The COMPASS heatmap shows 10 informative CD8 T cell subset responses to CMV, Epstein Barr virus (EBV) and influenza (CEF) combined peptide pool. IFN-γ containing subsets are noted in red. e, Polyfunctionality scores are depicted for n = 21 RSTRs and n = 21 LTBI subjects with boxplots show median and interquartile ranges. Statistical significance was calculated by Mann–Whitney U test and the two-tailed P value is shown. f, Representative flow cytometry plots from a ‘resister’ and LTBI subject display nearly equivalent frequencies of CD107a+IFN-γ+IL-2+TNF+ T cells (red dots) in response to stimulation with CEF or DMSO, with each experiment performed once.
Extended Data Fig. 5
Extended Data Fig. 5. Overlapping influenza HA-specific, IgG glycan distributions between ‘resisters’ and LTBI controls.
Principal component analysis demonstrates the overlapping profiles of ‘resisters’ (purple, n = 22) and TST/IGRA-positive LTBI (green, n = 19) individuals in the glycoform substructures isolated from influenza HA-specific IgG. The glycoform substructures of individuals are represented in the loadings plot (right), a mirror image of the dot plot (left), where the location of the glycoform substructures reflects the distribution of the individuals in the dot plot.
Extended Data Fig. 6
Extended Data Fig. 6. The statistical performance of the LASSO–PLSDA model.
To estimate the statistical significance of the model prediction by LASSO–PLSDA, two types of permutation tests were used: (1) shuffling the outcome label and (2) selecting randomized data sets. Each permutation test was performed 1,000 times and the prediction accuracy was calculated based using a receiver operating characteristic curve (shown in the dots). The empirical null distributions for each permutation test were generated and the nominal P values were calculated comparing the true model to the null distributions.
Extended Data Fig. 7
Extended Data Fig. 7. Reproducibility in antibody assays.
a, Variability between technical replicates in customized Luminex are shown by a representative dataset of ESAT6/CFP10 specific IgG MFI readings. b, Variability between technical replicates in Fc-effector functional assays are shown by a representative dataset of ESAT6/CFP10 specific antibody-dependent cellular phagocytosis scores. c, Variability between two different donors in NK cell activation is shown by percentage Mip1b positive from Donor C and Donor D. Correlations are determined by Spearman rank with P values as indicated.
Extended Data Fig. 8
Extended Data Fig. 8. Gating strategies for antibody-dependent phagocytosis, antibody-dependent neutrophil phagocytosis and NK cell activation.
a, Antibody-dependent cellular phagocytosis of PPD and or ESAT6/CFP10 adsorbed fluorescent FITC beads was measured in THP-1 monocytes. After gating on size, granularity and singlets, the frequency and mean fluorescence intensity of FITC beads was measured. The phagocytic score was calculated as the integrated MFI (percentage frequency × MFI/10,000). b, Antibody-dependent neutrophil phagocytosis of PPD adsorbed fluorescent FITC beads was measured. Neutrophils were identified by CD66b staining after gating on size, granularity and singlets. The frequency and mean fluorescence intensity of FITC beads was measured, and phagocytic score was calculated as the integrated MFI (percentage frequency × MFI/10,000). c, For antibody-dependent NK-cell activation, cells were first captured after gating on size, granularity and singlets. CD3+ T lymphocytes were gated out and CD16 was used to identify NK cells for which MIP-1β expression, and CD107a and IFN-γ production were measured.
Extended Data Fig. 9
Extended Data Fig. 9. Gating strategy for ICS.
A representative gating tree for flow analysis of cells following stimulation with antigen. Gating (top row) began with singlets, followed by viable cells. Lymphocytes were then identified by size, and CD3 expression was used to focus on T cells. The T cells were then separated into CD4 versus CD8 co-receptor subsets. For each subset (CD4 middle row, CD8 bottom row), cytokines were visualized by gating against IFN-γ. Pink boxes demonstrated positive staining. Positivity of cytokines was determined by DMSO negative and SEB positive controls as well as by gating on CD3 negative populations (not shown). Gating for CD4 and CD8 cytokines was determined separately.

References

    1. World Health Organization. Global Tuberculosis Report 2018 (WHO, Geneva, 2018).
    1. Pai M, et al. Gamma interferon release assays for detection of Mycobacterium tuberculosis infection. Clin. Microbiol. Rev. 2014;27:3–20. doi: 10.1128/CMR.00034-13. - DOI - PMC - PubMed
    1. Pai M, Zwerling A, Menzies D. Systematic review: T-cell-based assays for the diagnosis of latent tuberculosis infection: an update. Ann. Intern. Med. 2008;149:177–184. doi: 10.7326/0003-4819-149-3-200808050-00241. - DOI - PMC - PubMed
    1. Simmons, J. D. et al. Immunological mechanisms of human resistance to persistent Mycobacterium tuberculosis infection. Nat. Rev. Immunol.18, 575–589 (2018). - PMC - PubMed
    1. Meermeier Erin W., Lewinsohn David M. Early clearance versus control: what is the meaning of a negative tuberculin skin test or interferon-gamma release assay following exposure to Mycobacterium tuberculosis? F1000Research. 2018;7:664. doi: 10.12688/f1000research.13224.1. - DOI - PMC - PubMed

Publication types