. 2019 Aug;4(8):1356-1367.
doi: 10.1038/s41564-019-0449-y. Epub 2019 May 20.

Mediterranean grassland soil C-N compound turnover is dependent on rainfall and depth, and is mediated by genomically divergent microorganisms

Affiliations

Mediterranean grassland soil C-N compound turnover is dependent on rainfall and depth, and is mediated by genomically divergent microorganisms

Spencer Diamond et al. Nat Microbiol. 2019 Aug.

Abstract

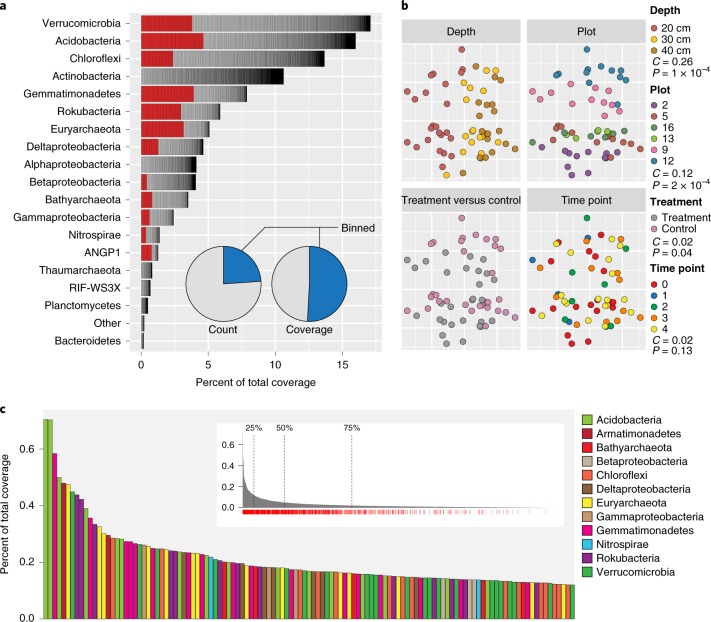
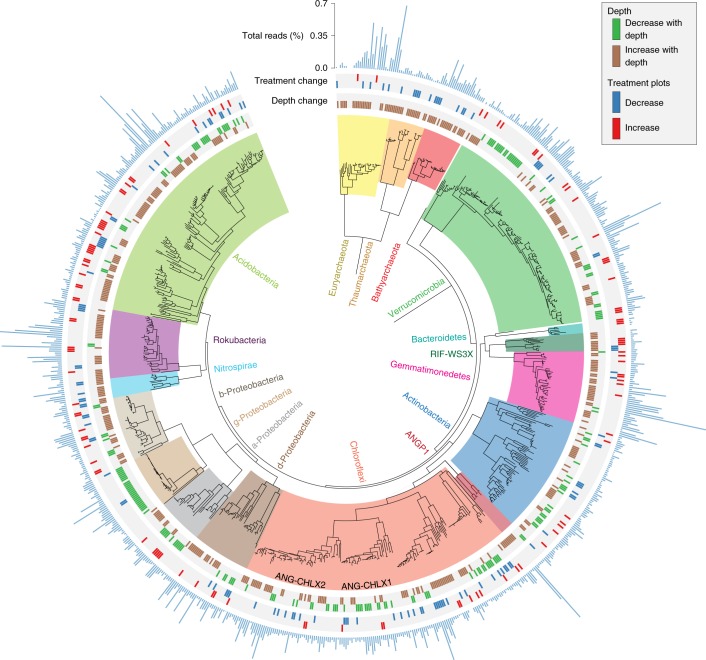
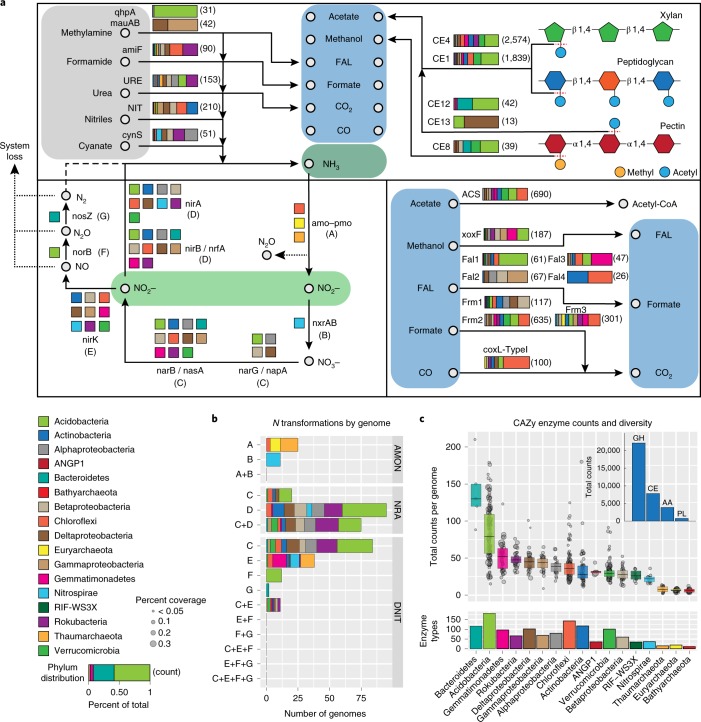
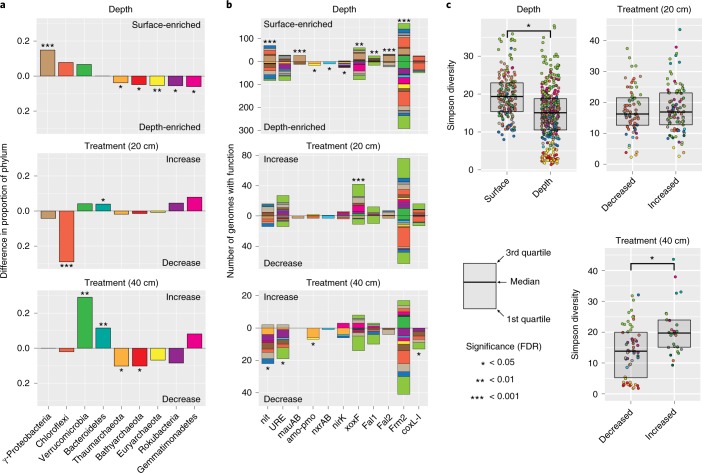
Soil microbial activity drives the carbon and nitrogen cycles and is an important determinant of atmospheric trace gas turnover, yet most soils are dominated by microorganisms with unknown metabolic capacities. Even Acidobacteria, among the most abundant bacteria in soil, remain poorly characterized, and functions across groups such as Verrucomicrobia, Gemmatimonadetes, Chloroflexi and Rokubacteria are understudied. Here, we have resolved 60 metagenomic and 20 proteomic data sets from a Mediterranean grassland soil ecosystem and recovered 793 near-complete microbial genomes from 18 phyla, representing around one-third of all microorganisms detected. Importantly, this enabled extensive genomics-based metabolic predictions for these communities. Acidobacteria from multiple previously unstudied classes have genomes that encode large enzyme complements for complex carbohydrate degradation. Alternatively, most microorganisms encode carbohydrate esterases that strip readily accessible methyl and acetyl groups from polymers like pectin and xylan, forming methanol and acetate, the availability of which could explain the high prevalence of C1 metabolism and acetate utilization in genomes. Microorganism abundances among samples collected at three soil depths and under natural and amended rainfall regimes indicate statistically higher associations of inorganic nitrogen metabolism and carbon degradation in deep and shallow soils, respectively. This partitioning decreased in samples under extended spring rainfall, indicating that long-term climate alteration can affect both carbon and nitrogen cycling. Overall, by leveraging natural and experimental gradients with genome-resolved metabolic profiles, we link microorganisms lacking prior genomic characterization to specific roles in complex carbon, C1, nitrate and ammonia transformations, and constrain factors that impact their distributions in soil.


Conflict of interest statement

The authors declare no competing interests.

Figures

Fig. 1
Fig. 1. rpS3 species group abundance, influence of variables and abundance metrics.
a, Percent of total coverage of all species groups (SGs) ranked by relative phylum coverage. ‘Other’ includes phyla with <5 SGs. Organisms in red are in the top 25% of organisms by coverage. Inset, pie charts showing the breakdown of SGs associated with genome bins (blue) based on count and coverage of SGs. b, NMDS plot (stress = 0.055) of SG UniFrac distances. The ordination is replicated and overlaid with the four data types collected across our 60 samples. Variable importance (C) and significance (P) calculated by an MRPP procedure are displayed in the key. c, Top 25% of SGs ranked by total coverage across all samples. Inset, full rank abundance curve showing the positions where 25%, 50% and 75% of the total data set coverage are reached. Red tick marks under the plot indicate SGs with bins. Also see Supplementary Table 5.
Fig. 2
Fig. 2. Maximum likelihood tree of all near-complete genomes.
Phylogenetic tree constructed with a concatenated alignment of 15 co-located ribosomal proteins (L2, L3, L4, L5, L6, L14, L15, L16, L18, L22, L24, S3, S8, S17 and S19). The tree includes 722 bacterial and 71 archaeal genomes. The two Chloroflexi classes basal to classic Chloroflexi lineages are named. Concentric rings moving outward from the tree indicate if a genome’s associated SG abundance was found to significantly increase or decrease with depth and increase or decrease in plots under extended rainfall treatment at either 10–20 cm or 30–40 cm. For all genomes shown, the direction of response (increase or decrease) to extended rainfall treatment was never different between depths. The concentric bar plot indicates relative abundance (see Methods). For the complete ribosomal protein tree, see Supplementary Fig. 4 and Supplementary Data 5. For all exact relative abundance values and differential abundance statistics, see Supplementary Table 5.
Fig. 3
Fig. 3. Predicted carbon and nitrogen metabolic transformations.
a, Predicted phylum-level genomic capacity for breakdown of small carbon- and nitrogen-containing compounds, and liberation of methyl and acetyl groups from complex polymers. Horizontal bar plots indicate the fraction of genomes within a phylum encoding each function (as shown in the key on the bottom left). Numbers to the right of bars in parentheses indicate the total number of genes detected (n = 793 independent genomes). NIT, nitrilase; URE, urease; FAL, formaldehyde oxidation; ACL, acetyl-CoA synthetase. b, Counts of genomes encoding capacities for individual or multiple nitrogen transformation steps. AMON, ammonia oxidation to nitrate; NRA, nitrate reduction to ammonia; DNIT, denitrification (n = 793 independent genomes). c, Top, counts of carbohydrate active (CAZy) enzymes across genomes in each phylum. Points indicate the total counts in individual genomes and point sizes reflect genome relative coverage across all samples (as shown in the key on the bottom left). Box plots enclose 1st to 3rd quartiles of data values, with a black line at the median value. Top inset, bar plot showing the total number of CAZy enzymes across all genomes belonging to each CAZy class (GH, glycosyl hydrolase; CE, carbohydrate esterase; AA, auxiliary activity; PL, polysaccharide lyase). Bottom, count of all 246 possible CAZy enzymes types that were identified across a phylum (n = 793 independent genomes). Also see Supplementary Tables 10–13.
Fig. 4
Fig. 4. Enrichment of phyla and metabolic functions across depth and treatment.
a, The difference in proportion of a phylum between genome groups that increase and decrease with depth/rainfall extension. Black asterisks indicate a significant enrichment of the phylum and bar direction indicates the genome set where the enrichment was found (two-sided permutation test: *false detection rate (FDR) ≤ 0.05, **FDR ≤ 0.01, ***FDR ≤ 0.001). b, Count of genomes encoding targeted carbon- and nitrogen-processing functions found to be significantly enriched in at least one comparison between genome groups that increase and decrease with depth/rainfall extension treatment. Genome counts only include those that were statistically different between depth or treatment shown. Black asterisks indicate a significant enrichment of the function and bar direction indicates the genome set where the enrichment was found (two-sided permutation test: *FDR ≤ 0.05, **FDR ≤ 0.01, ***FDR ≤ 0.001). Colours indicate phyla (see Fig. 3 for key). c, CAZy enzyme Simpson diversity distributions between genome groups that increase and decrease with depth/rainfall extension treatment. Simpson diversity has been transformed to the inverse form (1/(1 − Simpson)) for ease of viewing. Points are coloured by phylum (see Fig. 3 for key). A black asterisk between box plots indicates a statistical difference (two-sided Wilcoxon test: * FDR ≤ 0.05). Across all panels sample numbers were ndepth = 60 biologically independent samples, n20 cm treatment = 24 biologically independent samples and n40 cm treatment = 20 biologically independent samples. Across all panels the numbers of genomes analysed were ndepth = 570 independent genomes, n20 cm treatment = 173 independent genomes and n40 cm treatment = 85 independent genomes. All tests were corrected for multiple testing using FDR. For all exact FDR values, see Supplementary Tables 14–16.

References

    1. Boval M, Dixon RM. The importance of grasslands for animal production and other functions: a review on management and methodological progress in the tropics. Animal. 2012;6:748–762. - PubMed
    1. Eze S, Palmer SM, Chapman PJ. Soil organic carbon stock in grasslands: effects of inorganic fertilizers, liming and grazing in different climate settings. J. Environ. Manage. 2018;223:74–84. - PubMed
    1. Conrad R. Soil microorganisms as controllers of atmospheric trace gases (H2, CO, CH4, OCS, N2O, and NO) Microbiol. Rev. 1996;60:609–640. - PMC - PubMed
    1. Gougoulias C, Clark JM, Shaw LJ. The role of soil microbes in the global carbon cycle: tracking the below-ground microbial processing of plant-derived carbon for manipulating carbon dynamics in agricultural systems. J. Sci. Food Agric. 2014;94:2362–2371. - PMC - PubMed
    1. Delgado-Baquerizo M, et al. A global atlas of the dominant bacteria found in soil. Science. 2018;359:320–325. - PubMed

Publication types