

The Cost of Inflammatory Bowel Disease: An Initiative From the Crohn's & Colitis Foundation
- PMID: 31112238
- PMCID: PMC7534391
- DOI: 10.1093/ibd/izz104
The Cost of Inflammatory Bowel Disease: An Initiative From the Crohn's & Colitis Foundation
Erratum in
-
Corrigendum to The Cost of Inflammatory Bowel Disease: An Initiative From the Crohn's & Colitis Foundation.Inflamm Bowel Dis. 2020 Jun 18;26(7):1118. doi: 10.1093/ibd/izaa081. Inflamm Bowel Dis. 2020. PMID: 32374862 Free PMC article. No abstract available.
Abstract
Background: The Crohn's & Colitis Foundation's Cost of Inflammatory Bowel Disease (IBD) Care Initiative seeks to quantify the wide-ranging health care costs affecting patients living with IBD. We aimed to (1) describe the annualized direct and indirect costs of care for patients with Crohn's disease (CD) or ulcerative colitis (UC), (2) determine the longitudinal drivers of these costs, and (3) characterize the cost of care for newly diagnosed patients.
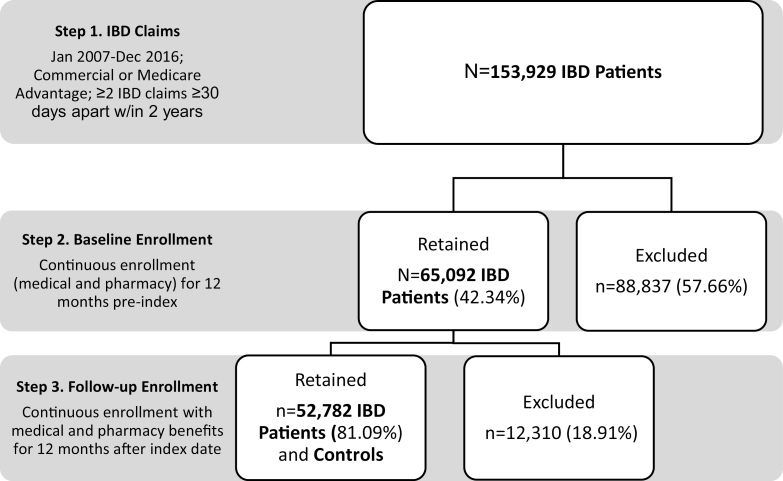
Methods: We analyzed the Optum Research Database from the years 2007 to 2016, representing commercially insured and Medicare Advantage-insured patients in the United States. Inclusion for the study was limited to those who had continuous enrollment with medical and pharmacy benefit coverage for at least 24 months (12 months before through 12 months after the index date of diagnosis). The value of patient time spent on health care was calculated as number of workplace hours lost due to health care encounters multiplied by the patients' estimated average wage derived from the Bureau of Labor Statistics. Comparisons between IBD patients and non-IBD patients were analyzed based on demographics, health plan type, and length of follow-up. We used generalized linear models to estimate the association between total annual costs and various patient variables.
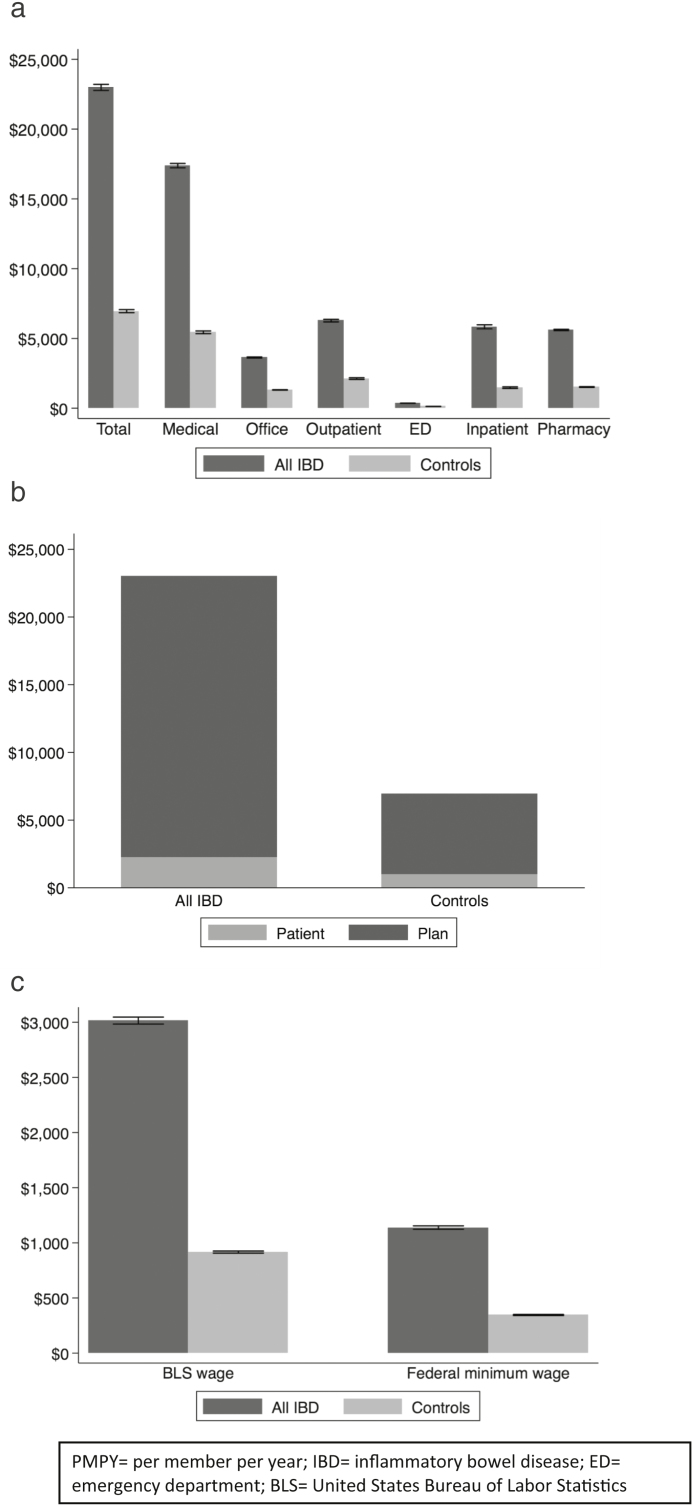
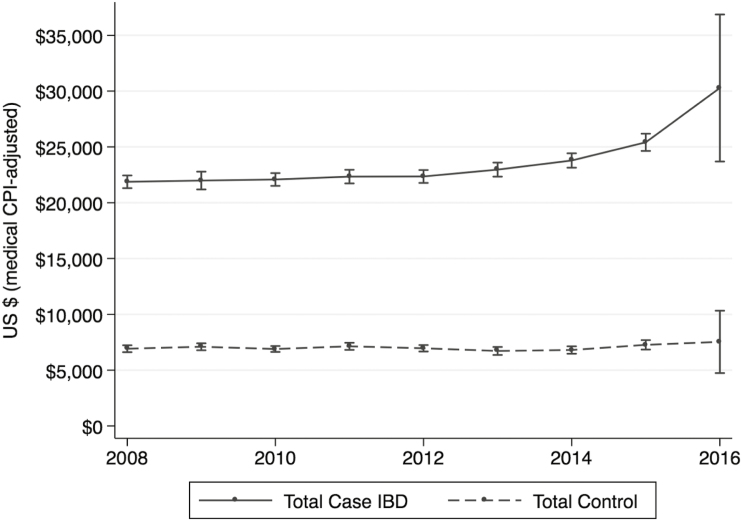
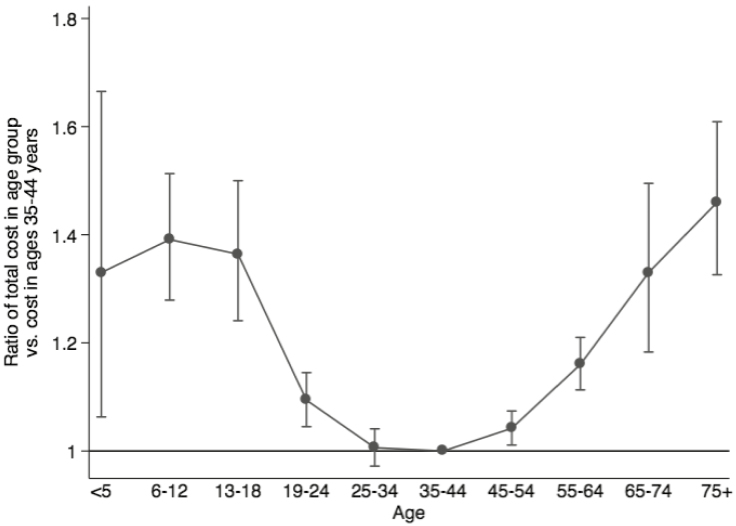
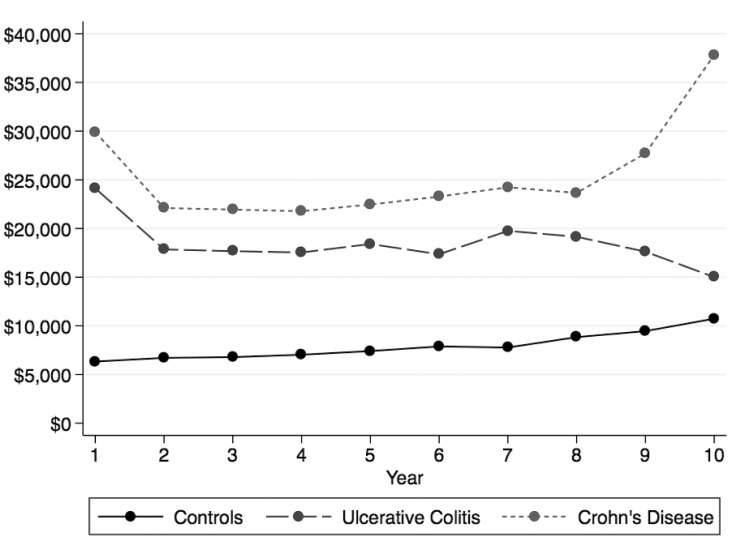
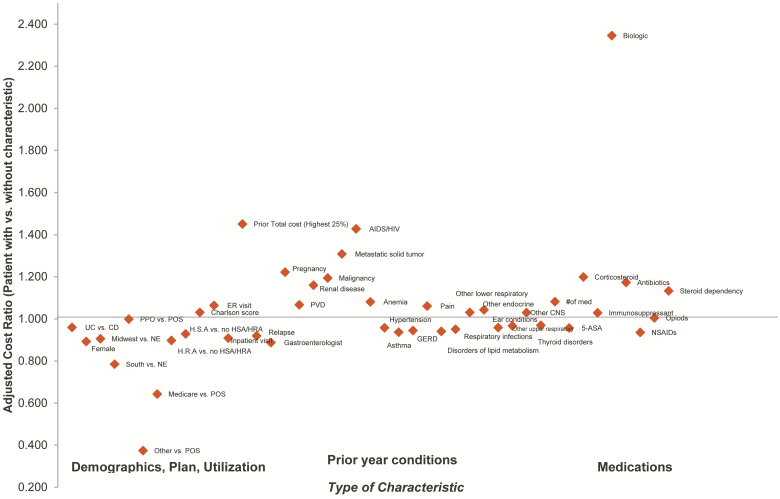
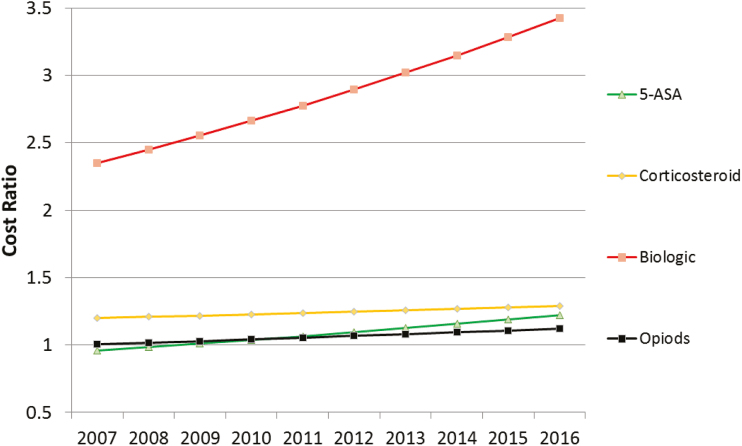
Results: There were 52,782 IBD patients (29,062 UC; 23,720 CD) included in the analysis (54.1% females). On a per-annual basis, patients with IBD incurred a greater than 3-fold higher direct cost of care compared with non-IBD controls ($22,987 vs $6956 per-member per-year paid claims) and more than twice the out-of-pocket costs ($2213 vs $979 per-year reported costs), with all-cause IBD costs rising after 2013. Patients with IBD also experienced significantly higher costs associated with time spent on health care as compared with controls. The burden of costs was most notable in the first year after initial IBD diagnosis (mean = $26,555). The study identified several key drivers of cost for IBD patients: treatment with specific therapeutics (biologics, opioids, or steroids); ED use; and health care services associated with relapsing disease, anemia, or mental health comorbidity.
Conclusion: The costs of care for IBD have increased in the last 5 years and are driven by specific therapeutics and disease features. In addition, compared with non-IBD controls, IBD patients are increasingly incurring higher costs associated with health care utilization, out-of-pocket expenditures, and workplace productivity losses. There is a pressing need for cost-effective strategies to address these burdens on patients and families affected by IBD.
Keywords: Costs of care; Crohn’s disease; anemia; biologics; direct costs; emergency room use; indirect costs; inflammatory bowel diseases; mental health; narcotics; opioids; steroids; ulcerative colitis.
© 2019 Crohn’s & Colitis Foundation. Published by Oxford University Press on behalf of Crohn’s & Colitis Foundation.
Figures
References
-
- Dahlhamer JM, Zammitti EP, Ward BW, et al. . Prevalence of inflammatory bowel disease among adults aged ≥18 years—United States, 2015. MMWR Morb Mortal Wkly Rep. 2016;65(42):1166–1169. - PubMed
-
- Sonnenberg A. Demographic characteristics of hospitalized IBD patients. Dig Dis Sci. 2009;54:2449–2455. - PubMed
-
- Kaplan GG. The global burden of IBD: from 2015 to 2025. Nat Rev Gastroenterol Hepatol. 2015;12:720–727. - PubMed
-
- Gibson TB, Ng E, Ozminkowski RJ, et al. . The direct and indirect cost burden of Crohn’s disease and ulcerative colitis. J Occup Environ Med. 2008;50:1261–1272. - PubMed
-
- Park KT, Colletti RB, Rubin DT, et al. . Health insurance paid costs and drivers of costs for patients with Crohn’s disease in the United States. Am J Gastroenterol. 2016;111:15–23. - PubMed
Publication types
MeSH terms
LinkOut - more resources
Full Text Sources
Other Literature Sources
Medical
