

Trends in Levels of Lipids and Apolipoprotein B in US Youths Aged 6 to 19 Years, 1999-2016
- PMID: 31112258
- PMCID: PMC6537842
- DOI: 10.1001/jama.2019.4984
Trends in Levels of Lipids and Apolipoprotein B in US Youths Aged 6 to 19 Years, 1999-2016
Abstract
Importance: Favorable trends occurred in the lipid levels of US youths through 2010, but these trends may be altered by ongoing changes in the food supply, obesity prevalence, and other factors.
Objective: To analyze trends in levels of lipids and apolipoprotein B in US youths during 18 years from 1999 through 2016.
Design, setting, and participants: Serial cross-sectional analysis of US population-weighted data for youths aged 6 to 19 years from the National Health and Nutrition Examination Surveys for 1999 through 2016. Linear temporal trends were analyzed using multivariable regression models with regression coefficients (β) reported as change per 1 year.
Exposures: Survey year; examined periods spanned 10 to 18 years based on data availability.
Main outcomes and measures: Age- and race/ethnicity-adjusted mean levels of high-density lipoprotein (HDL), non-HDL, and total cholesterol. Among fasting adolescents (aged 12-19 years), mean levels of low-density lipoprotein cholesterol, geometric mean levels of triglycerides, and mean levels of apolipoprotein B. Prevalence of ideal and adverse (vs borderline) levels of lipids and apolipoprotein B per pediatric lipid guidelines.
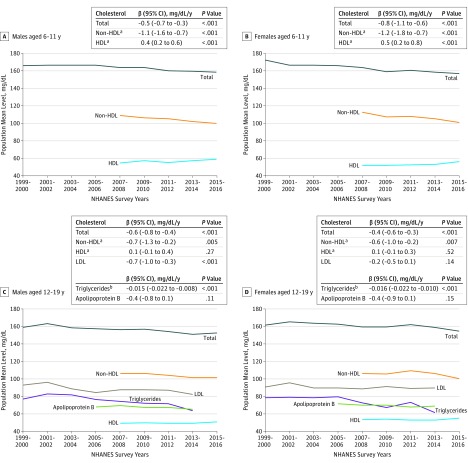
Results: In total, 26 047 youths were included (weighted mean age, 12.4 years; female, 51%). Among all youths, the adjusted mean total cholesterol level declined from 164 mg/dL (95% CI, 161 to 167 mg/dL) in 1999-2000 to 155 mg/dL (95% CI, 154 to 157 mg/dL) in 2015-2016 (β for linear trend, -0.6 mg/dL [95% CI, -0.7 to -0.4 mg/dL] per year). Adjusted mean HDL cholesterol level increased from 52.5 mg/dL (95% CI, 51.7 to 53.3 mg/dL) in 2007-2008 to 55.0 mg/dL (95% CI, 53.8 to 56.3 mg/dL) in 2015-2016 (β, 0.2 mg/dL [95% CI, 0.1 to 0.4 mg/dL] per year) and non-HDL cholesterol decreased from 108 mg/dL (95% CI, 106 to 110 mg/dL) to 100 mg/dL (95% CI, 99 to 102 mg/dL) during the same years (β, -0.9 mg/dL [95% CI, -1.2 to -0.6 mg/dL] per year). Among fasting adolescents, geometric mean levels of triglycerides declined from 78 mg/dL (95% CI, 74 to 82 mg/dL) in 1999-2000 to 63 mg/dL (95% CI, 58 to 68 mg/dL) in 2013-2014 (log-transformed β, -0.015 [95% CI, -0.020 to -0.010] per year), mean levels of low-density lipoprotein cholesterol declined from 92 mg/dL (95% CI, 89 to 95 mg/dL) to 86 mg/dL (95% CI, 83 to 90 mg/dL) during the same years (β, -0.4 mg/dL [95% CI, -0.7 to -0.2 mg/dL] per year), and mean levels of apolipoprotein B declined from 70 mg/dL (95% CI, 68 to 72 mg/dL) in 2005-2006 to 67 mg/dL (95% CI, 65 to 70 mg/dL) in 2013-2014 (β, -0.4 mg/dL [95% CI, -0.7 to -0.04 mg/dL] per year). Favorable trends were generally also observed in the prevalence of ideal and adverse levels. By the end of the study period, 51.4% (95% CI, 48.5% to 54.2%) of all youths had ideal levels for HDL, non-HDL, and total cholesterol; among adolescents, 46.8% (95% CI, 40.9% to 52.6%) had ideal levels for all lipids and apolipoprotein B, whereas 15.2% (95% CI, 13.1% to 17.3%) of children aged 6 to 11 years and 25.2% (95% CI, 22.2% to 28.2%) of adolescents aged 12 to 19 years had at least 1 adverse level.
Conclusions and relevance: Between 1999 and 2016, favorable trends were observed in levels of lipids and apolipoprotein B in US youths aged 6 to 19 years.
Conflict of interest statement
Figures
References
-
- Lloyd-Jones DM, Hong Y, Labarthe D, et al. . Defining and setting national goals for cardiovascular health promotion and disease reduction: the American Heart Association’s strategic impact goal through 2020 and beyond. Circulation. 2010;121(4):586-613. doi:10.1161/CIRCULATIONAHA.109.192703 - DOI - PubMed
-
- Pacifico L, Bonci E, Andreoli G, et al. . Association of serum triglyceride-to-HDL cholesterol ratio with carotid artery intima-media thickness, insulin resistance and nonalcoholic fatty liver disease in children and adolescents. Nutr Metab Cardiovasc Dis. 2014;24(7):737-743. doi:10.1016/j.numecd.2014.01.010 - DOI - PubMed
Publication types
MeSH terms
Substances
Grants and funding
LinkOut - more resources
Full Text Sources
Medical
