Review
. 2019 Sep;116(9):2393-2411.
doi: 10.1002/bit.27024. Epub 2019 Jun 24.

Nanoscale integration of single cell biologics discovery processes using optofluidic manipulation and monitoring

Affiliations
Review

Nanoscale integration of single cell biologics discovery processes using optofluidic manipulation and monitoring

Marsela Jorgolli et al. Biotechnol Bioeng. 2019 Sep.

Abstract

The new and rapid advancement in the complexity of biologics drug discovery has been driven by a deeper understanding of biological systems combined with innovative new therapeutic modalities, paving the way to breakthrough therapies for previously intractable diseases. These exciting times in biomedical innovation require the development of novel technologies to facilitate the sophisticated, multifaceted, high-paced workflows necessary to support modern large molecule drug discovery. A high-level aspiration is a true integration of "lab-on-a-chip" methods that vastly miniaturize cellulmical experiments could transform the speed, cost, and success of multiple workstreams in biologics development. Several microscale bioprocess technologies have been established that incrementally address these needs, yet each is inflexibly designed for a very specific process thus limiting an integrated holistic application. A more fully integrated nanoscale approach that incorporates manipulation, culture, analytics, and traceable digital record keeping of thousands of single cells in a relevant nanoenvironment would be a transformative technology capable of keeping pace with today's rapid and complex drug discovery demands. The recent advent of optical manipulation of cells using light-induced electrokinetics with micro- and nanoscale cell culture is poised to revolutionize both fundamental and applied biological research. In this review, we summarize the current state of the art for optical manipulation techniques and discuss emerging biological applications of this technology. In particular, we focus on promising prospects for drug discovery workflows, including antibody discovery, bioassay development, antibody engineering, and cell line development, which are enabled by the automation and industrialization of an integrated optoelectronic single-cell manipulation and culture platform. Continued development of such platforms will be well positioned to overcome many of the challenges currently associated with fragmented, low-throughput bioprocess workflows in biopharma and life science research.

Keywords: advanced biotechnology; bioassay development; digital cell biology; drug discovery; nanoscale cell culture; optical manipulation techniques; single cell technology.


Figures

Figure 1
Figure 1
Optical manipulations | (a) Schematic of single‐beam optical tweezers: Particles as small as tens of nanometers are trapped by an optical gradient force generated via a high‐intensity laser (105 to 107 W/cm2; Grier, 2003). (b) Example of a nucleic acid system studied using optical tweezers, showing nanomechanical properties of filaments subjected to twist: The relative extension of DNA is monitored as trapped DNA is twisted with an optical torque wrench. The coiled DNA undergoes a phase transition from a twisted to a plectonemic form approximately 0.14 supercoiling density (Fazal & Block, 2011). (c) Plasmonic tweezers schematic: Patterned gold nanopillars give rise to localized surface plasmons causing a strong field enhancement under the trapping beam and suppression of the Brownian motion (characteristic of POT) resulting in improved particle confinement (Reece, 2008). (d) Molecular manipulation via plasmonic tweezers: A single bovine serum albumin (BSA) protein is trapped in the gap of a double hole nanostructure (Pang & Gordon, 2011). (e) Schematic of an optoelectronic tweezer device consisting of: a photoconductive layer of hydrogenated amorphous silicon (a‐Si:H) on an indium tin oxide (ITO) coated glass substrate (bottom layer), a liquid containing microparticles is sandwiched between the bottom layer and the top ITO‐coated glass layer. An AC electrical signal between the top and bottom layers in combination with patterned illumination create a nonuniform electric field that results in particle manipulation via dielectrophoresis (DEP; M. C. Wu, 2011). (f) Top image shows 20‐micron polystyrene particles confined in patterned light cages. Bar = 20  μm; Bottom image of shows virtual electrode cages (yellow) formed from projected light pattern to precisely control the position of individual cells. Bar = 50 μm (Hsu et al., 2010; M. C. Wu, 2011). POT, plasmonic optical tweezers
Figure 2
Figure 2
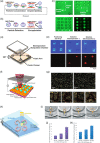
OET Bench‐scale applications | (a) Schematic of serial particle concentration: A light pattern is swept across the device concentrating beads at one end of the droplet via OET, followed by droplet splitting via OEW. Reiteration of this process results in an exponential increase in particle concentration (Valley et al., 2011). (b) Schematic of single cell selection and encapsulation: Patterned lights move specified cells in opposite sides of the droplet via OET, followed by droplet splitting via OEW resulting in a droplet with the single cell of interest (Valley et al., 2011). (c) A 4 × 4 array of droplets is formed by selectively positioning eight positives and eight negative controls. The negative control droplets contain blank viral transport medium while the positive control droplets contain 1.45 × 103 viral‐particles/nl. No cross‐contamination was observed in the fluorescent image of the polymerase chain reaction (PCR) amplified products (Pei et al., 2015). (d) Schematic of light‐induced electroporation device: a top substrate is coated with the transparent conductor indium tin oxide (ITO), a middle layer consists of patterned SU‐8 layer defining the channel geometry, while bottom substrate coated with ITO and a photosensitive film (a‐Si:H; Valley et al., 2009). (e) First cells are positioned in a 2 × 2 array via low bias OET (0.2 kV/cm), first column, followed by a high bias (1.5 kV/cm) two‐step electroporation of specific cells. Fluorescent images show that only selected cells were electroporated, resulting in selective intracellular delivery of the membrane impermeant PI dye (Y. Yang et al., 2016). (f) Schematic of self‐locking optoelectronic tweezers (SLOT) consisting of a high‐density array of ring‐shaped electrodes, each controlled via an underlying phototransistor (Y. Yang et al., 2016). (g) Polystyrene beads (8‐μm) trapped in parallel on a 1 cm2 SLOT platform with more than 250,000 phototransistor traps. Initially, the particles are randomly distributed, next applied AC voltage between the top and bottom layer results in particle self‐locking into nearby traps. A scanning light beam selectively releases trapped particles, as shown through the formation of four letters – UCLA (Y. Yang et al., 2016). (h) Schematic of TiOPc‐based immunotherapy µ‐environment LabChip: consisting of PEG‐DA hydrogel four‐leaf‐clover‐shape (FLCS) microwells to generate a biomimetic environment (Ke et al., 2017). (i) Real‐time analysis of NK cell's behavior. Representative images showing NK cell and target cell morphologies over time to track immune cell cytotoxicity (Ke et al., 2017). (j) Percentage of target cells killed at a 1:1 ratio of NK cells: Target Cells (Ke et al., 2017). (k) Percentage of target cells killed at a 10:1 ratio of NK cells: Target Cells (Ke et al., 2017). NK, natural killer; OET, optoelectronic tweezer; OEW, optoelectrowetting; PI, propidium iodide
Figure 3
Figure 3
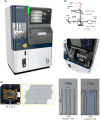
Platform technology: Beacon® | (a) Representative image of the instrument consisting of four bays: sample and chip, electronics, reagents, and waste. Dimensions: 42”W 32”D 72”H. (b) Schematics of the optical system: Camera: Andor Zyla; Filter changer: DAPI (Ex 390/40, DC BLTS‐0025), Em 452/45, FITC (Ex 475/50, DC 509‐FDi01, Em 540/50), TxRED (Ex 562/40, DC BLTS‐0026, Em 624/40), Cy5 (Ex 628/40, DC BLTS‐0027, EM 692/40), OEP (Ex 405R, DC 90R/10T, Em BLTS‐0030); Objective changer: Olympus Xfluor 4×/0.28 WD29mm, Nikon Plan Fluor 10×/0.30 WD 16 mm. (c) Sample bay hosting four nests, optics, camera, robotics, and plate incubators. (d) Representative image of a chip and the schematics of its fluidic structure. NanoPen structures associated with two different chip designs facilitate a variety of processes at different dimensions. OEP, opto‐electro‐positioning
Figure 4
Figure 4
Primary ASC based antibody discovery | (a) Workflow overview: Immunization schedules designed to enhance the relative frequency of ASCs in specific compartments. Specific organ compartments were harvested, and ASCs enriched using magnetic bead negative selection followed by a multicolor FACS sorting strategy. Iterative multiplex screens were performed on the OEP platform. Selected hits were exported, the VH and VL sequences recovered via multiplex PCR, and the IgGs recombinantly expressed for further characterization. (b) Multiplex bead‐based assay design for soluble antigens: Bead size, antigen, secondary antibodies and detection fluorophore were chosen to specifically enable robust identification of antigen‐specific ASCs. (c) Images of IgG secreting (TRed) antigen‐specific (Cy5) B cells at two concentrations of antigen. (d) Percentages of IgG+ and antigen+ wells identified from enriched normal mouse ASCs as a function of time on chip. ASCs, antibody‐secreting cell; OEP, opto‐electro‐positioning; PCR, polymerase chain reaction
Figure 5
Figure 5
Engineered antibody screening | (a) Optimization of the transient process demonstrates robust detection of secreted antibody 24 hr posttransfection. Bead‐based IgG assay was sequentially run 2 hr (Assay A) and 24 hr (Assay B) after cell loading to assess the antibody secretion levels over time. (b) Bead‐based IgG secretion rankings of 10 different anti‐G‐protein‐coupled receptors (GPCR) antibodies accurately correlate with the FortéBio titers of standard production cultures for both stable CHO and HEK 293‐6E cell hosts. (c) IgG‐ and antigen‐specific diffusion assays enable differentiation of high affinity vs. low affinity anti‐GPCR antibodies. Binding affinity is calculated via the assessment of the remaining amount of labeled peptide and antigen, pseudocolored in magenta. CHO, Chinese hamster ovary
Figure 6
Figure 6
Single‐cell quantitative assay | (a) Workflow schematic: After loading, cells are identified and trapped into light cages facilitating single‐cell penning via OEP. Next, low concentration (0.125 µg/ml) of dye‐labeled (A647) target (receptor ECD) is imported and incubated for 10 min followed by multiplexed image acquisition (bright field, FITC, and Cy5). The process is reiterated at increasing target concentrations up to 1 µg/ml. (b) Loaded and penned six different yeast‐displayed peptides (P1–P6), previously induced, in specified chip region shown in different colors. Bar = 150 µm. (c) Representative fluorescent image used to quantify the concentration of bound receptor to peptides displayed on individual yeast cells; Schematic of the automated data analysis SNR: Fluorescence intensity of individual cells (circled in red) is normalized by the fluorescence intensity of the background via the creation of a doughnut region (gray) around each region of interest. Bar = 50 µm. (d) Relative ranking of binding affinity: S/N Ratio plotted versus a series of receptor ECD concentrations from 0.125 to 1 µg/ml. (e) GPCR binding affinity rankings (SNR) generated on the OEP platform ‐ based on individual cell analysis ‐ were consistent with conventional measurements (FACS). ECD, extracellular domain; GPCR, G‐protein‐coupled receptors; OEP, opto‐electro‐positioning; SNR, signal‐to‐noise ratio
Figure 7
Figure 7
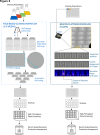
Comparison of a microtiter plate based cloning workflow vs. a nanofluidic chip subcloning workflow. A depiction of the steps involved in performing a clonal isolation and expansion workflow using two approaches. Differences are highlighted in boxes for FACS‐based workflow(solid) and platform workflow (dotted). Standard subcloning operation: A heterogeneous population is isolated and deposited into microtiter plates using FACS‐based cell sorting, followed with high‐quality, high‐throughput whole well imaging to verify a single cell in a well. After growth and repeated imaging, colonies are picked and consolidated using automation liquid handlers. Top clones are then screened in a bioreactor to select the final clone. In contrast, the platform workflow enables single cell isolation, growth assessment, and high‐throughput screen on the chip (dotted box) in the nanofluidic workflow, and only those clones that meet the desired criteria are exported and expanded for further evaluation (Le et al., 2018)

References

    1. Akagi, S. , Nakajima, C. , Tanaka, Y. , & Kurihara, Y. (2018). Flow cytometry‐based method for rapid and high‐throughput screening of hybridoma cells secreting monoclonal antibody. Journal of Bioscience and Bioengineering, 125(4), 464–469. 10.1016/j.jbiosc.2017.10.012 - DOI - PubMed
    1. Alber, A. B. , & Suter, D. M. (2019). Dynamics of protein synthesis and degradation through the cell cycle. Cell Cycle, 18(8), 784–794. 10.1080/15384101.2019.1598725 - DOI - PMC - PubMed
    1. Ashkin, A. (1970). Acceleration and trapping of particles by radiation pressure. Physical Review Letters, 24(4), 156–159. 10.1103/physrevlett.24.156 - DOI
    1. Ashkin, A. (1992). Forces of a single‐beam gradient laser trap on a dielectric sphere in the ray optics regime. Biophysical Journal, 61(2), 569–582. 10.1016/S0006-3495(92)81860-X - DOI - PMC - PubMed
    1. Ashkin, A. , Dziedzic, J. M. , Bjorkholm, J. E. , & Chu, S. (1986). Observation of a single‐beam gradient force optical trap for dielectric particles. Optics Letters, 11(5), 288 - PubMed

Substances