. 2019 May 21;129(8):3347-3360.
doi: 10.1172/JCI127726.

The local immune landscape determines tumor PD-L1 heterogeneity and sensitivity to therapy

Affiliations

The local immune landscape determines tumor PD-L1 heterogeneity and sensitivity to therapy

Yuan Wei et al. J Clin Invest. .

Abstract

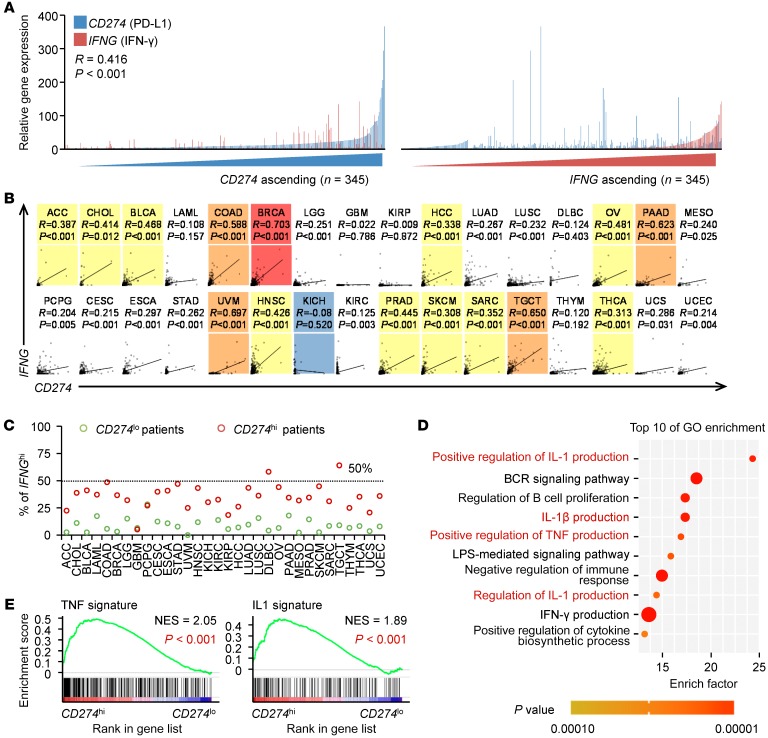
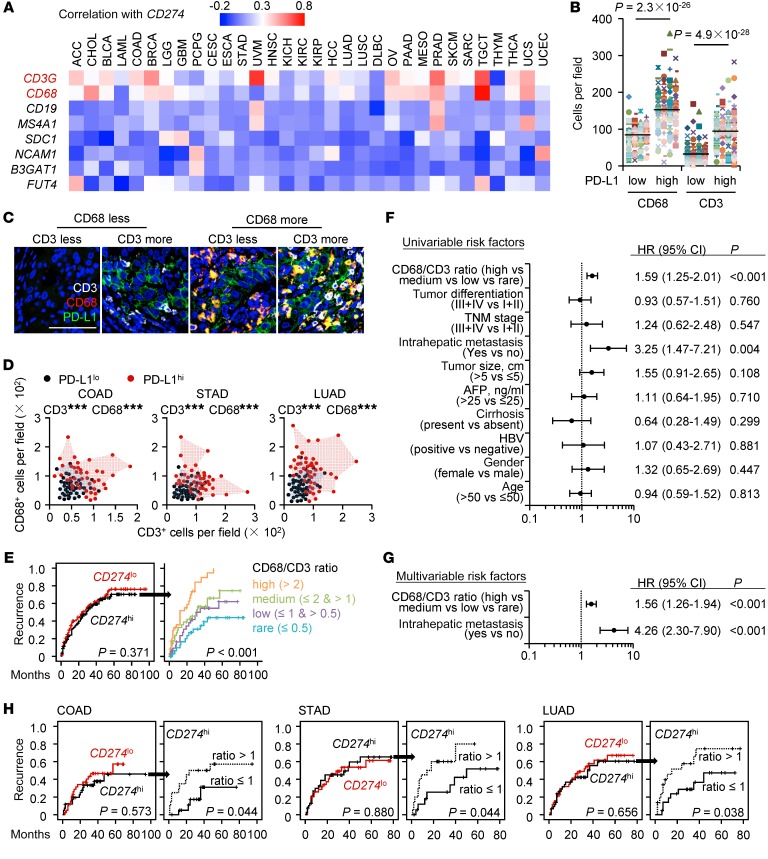
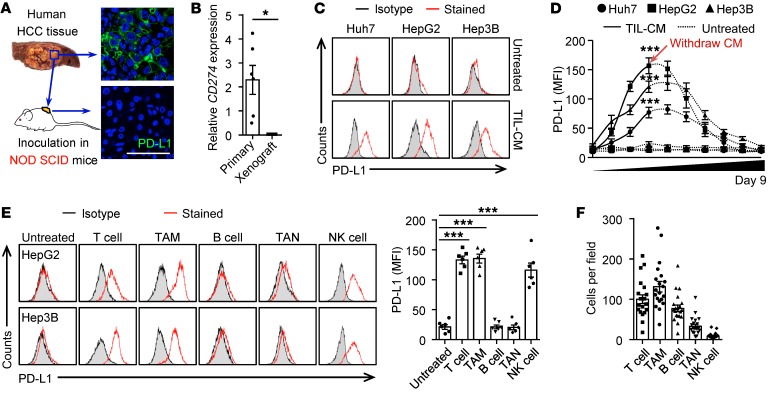
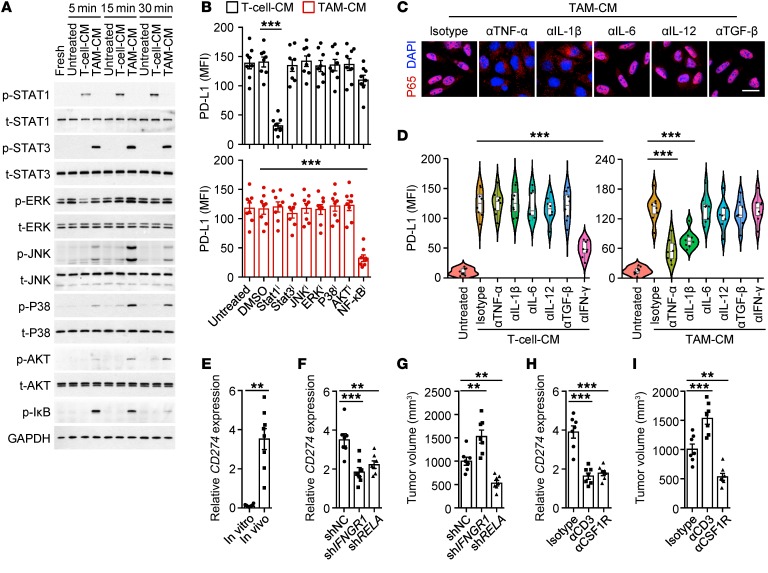
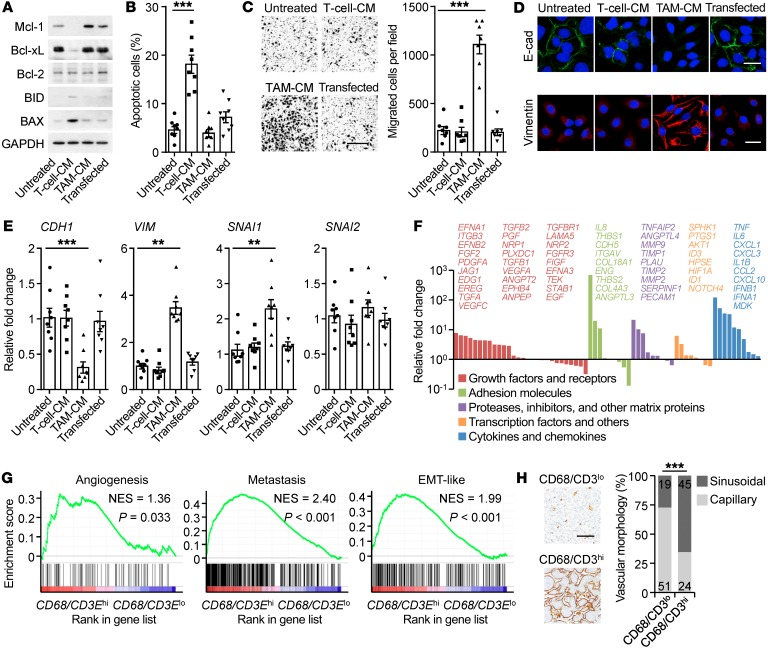
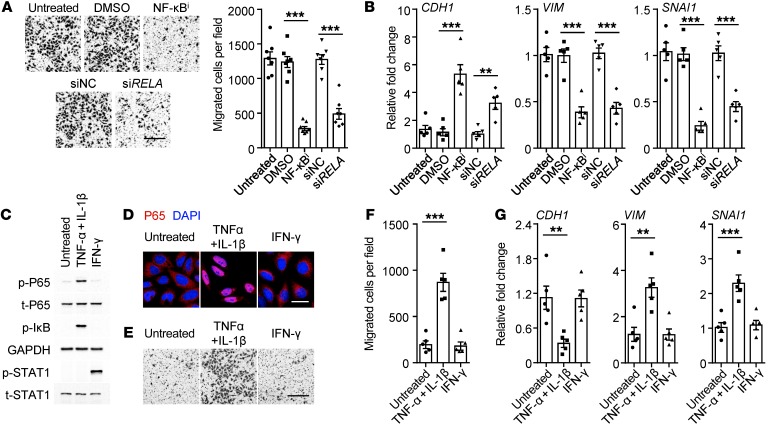
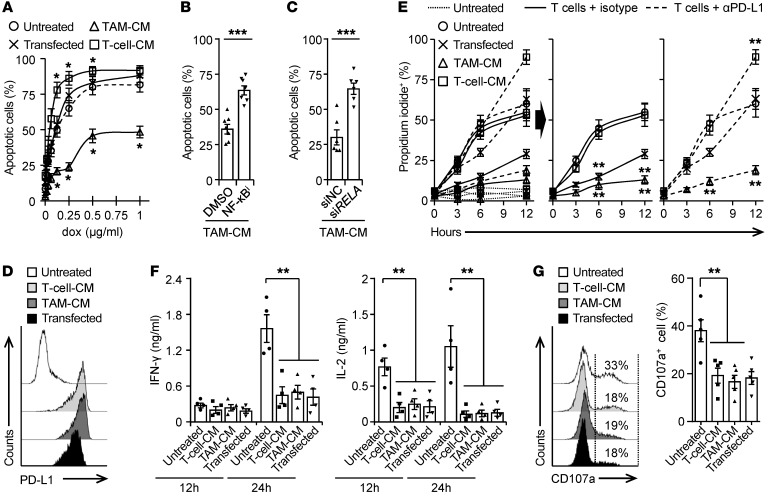
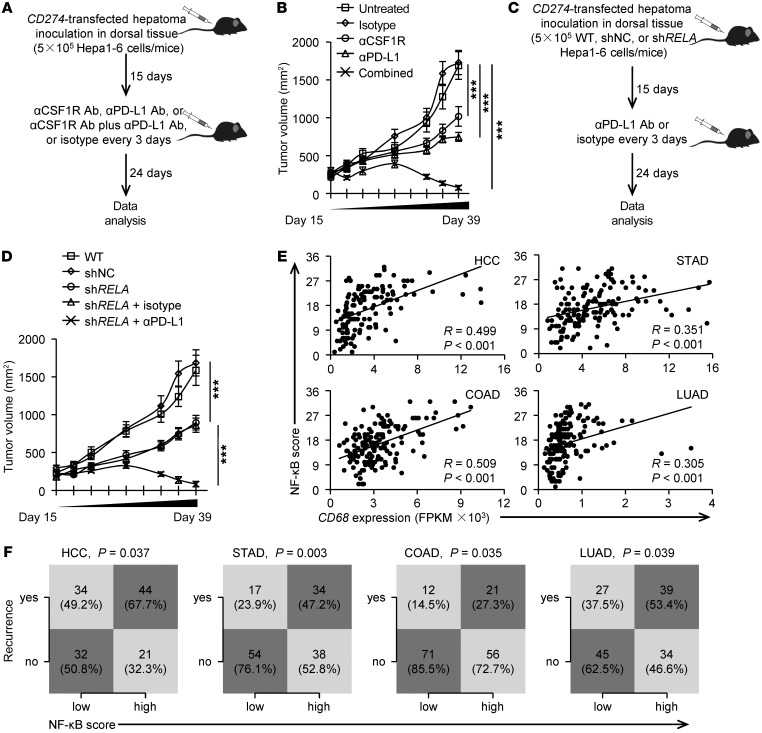
PD-L1 is a promising therapeutic target in aggressive cancers. However, immune landscapes and cancer hallmarks of human PD-L1+ tumors, as well as their roles in determining therapeutic efficacies are unknown. Here we identified, in detailed studies of gene data regarding 9769 patients of 32 types of human cancers, that PD-L1 could not exclusively represent IFN-γ signature and potentially signified pro-inflammatory myeloid responses in a tumor. PD-L1 heterogeneity endowed by local immune landscapes controlled cancer hallmarks and clinical outcomes of patients. Mechanically, NF-κB signal elicited by macrophage inflammatory responses generated PD-L1+ cancer cells exhibiting capabilities to aggressively survive, support angiogenesis, and metastasize, whereas STAT1 signal triggered by activated T cells induced PD-L1+ cancer cells susceptive to apoptosis. Importantly, PD-L1+ cancer cells generated by macrophages established great resistance to conventional chemotherapy, cytotoxicity of tumor-specific effector T cells, and therapy of immune checkpoint blockade. Therapeutic strategy combining immune checkpoint blockade with macrophage depletion or NF-κB inhibition in vivo effectively and successfully elicited caner regression. Our results provide insight into the functional features of PD-L1+ tumors and suggest that strategies to influence functional activities of inflammatory cells may benefit immune checkpoint blockade therapy.

Keywords: Cancer immunotherapy; Immunology; Inflammation.


Conflict of interest statement

Conflict of interest: The authors have declared that no conflict of interest exists.

Figures

Figure 1
Figure 1. PD-L1 reflects multiple immune signatures in human cancers.
(A) Expression of IFNG (IFN-γ) and CD274 (PD-L1) in 345 HCC tissues. Patients were ranked in ascending order of IFNG or CD274 expression. (B) Correlations between IFNG and CD274 in 9138 patients with 32 types of cancer samples from TCGA data set. P values and R values were calculated based on the analysis of Pearson’s correlation. (C) 9138 Patients with 32 types of cancer samples were divided into 2 groups according to the mean value of CD274 or IFNG expression within each tumor type. The ratios of CD274hi and CD274lo patients expressing higher levels of IFNG were shown. (D) Top 10 biological processes (GO terms) enriched in 53 genes strongly correlated with CD274 expression in HCC samples from TCGA data set (R > 0.5; P < 0.0001). (E) GSEA of TNF signature (left) and IL-1 signature (right) in CD274hi HCC samples versus CD274lo counterparts from TCGA data set. The enrichment scores and P values were calculated by GSEA with weighted enrichment statistics and ratio of classes for the metric as input parameters.
Figure 2
Figure 2. Immune landscapes of PD-L1hi cancers affect patients’ clinical outcomes.
(A) Correlations between CD274 and indicated genes were calculated in 9138 patients with 32 types of cancer samples from TCGA data set. (B) Correlations of macrophage and T cell densities with PD-L1 expression in HCC tissues (n = 276). Student’s t test. (C) Confocal microscopy analysis of PD-L1+ cells (green), CD68+ macrophages (red), and CD3+ T cells (white) in HCC tissue. Results represent 3 independent experiments (n = 8). Scale bar: 100 μm. (D) Densities of macrophages and T cells in PD-L1lo or PD-L1hi COAD (n = 82), STAD (n = 78), and LUAD (n = 89) tissues. (E) 276 Patients with HCC were divided into 2 groups according to the median value of CD274 expression in tumors: red lines, low expression (n = 138); black lines, high expression (n = 138). 138 CD274hi patients were further divided into 4 groups according to the ratio of macrophages to T cells in tumors: orange line, ratio value > 2, n = 39; green line, ratio value ≤ 2 and > 1, n = 30; purple line, ratio value ≤ 1 and > 0.5, n = 31; blue line, ratio value ≤ 0.5, n = 38. (F and G) Univariate (F) and multivariate (G) regression analyses of factors associated with recurrence. Cox proportional hazards regression model. (H) 82, 78, and 89 Patients with COAD, STAD, and LUAD, respectively, were analyzed for the prognosis value of CD274 expression plus macrophage/T cell ratio. Patients were divided into 2 groups according to the value of CD274 expression in tumors or ratio of macrophages to T cells in CD274hi tumors. Recurrence times were calculated by the Kaplan-Meier method and analyzed by the log-rank test. ***P < 0.001.
Figure 3
Figure 3. Tumor macrophages and T cells effectively induce cancer cell PD-L1.
(A and B) PD-L1 expression in human HCC tissue before or after 25-day inoculation in NOD SCID mice (n = 6). Scale bar: 100 μm. (CE) Human hepatoma cells were left untreated or were treated with CM from HCC-infiltrating leukocytes (TIL-CM) (C and D) or indicated immune cells isolated from HCC tumors (E). Expression of PD-L1 was determined by FACS on day 3 (C and E) or indicated time (D) (n = 5 for C and D; n = 6 for E). (F) Density of indicated cells in HCC tumor tissue (n = 20). Data represent mean ± SEM. Results are representative of 4 separate experiments. *P < 0.05; ***P < 0.001, Student’s t test (B and D) or 1-way ANOVA with Dunett’s post test (E).
Figure 4
Figure 4. Distinct induction patterns of cancer cell PD-L1 by tumor macrophages and T cells.
(A) HepG2 cells were left untreated or were incubated with T cell–CM or TAM-CM for indicated times. Activation of indicated pathways was analyzed by immunoblotting (n = 4). (B) Effects of signaling pathway inhibitor on HepG2 cell PD-L1 expression induced by T cell–CM or TAM-CM (n = 8). (C and D) Effects of cytokine neutralizing Ab on P65 nuclear translocation (C) or PD-L1 expression (D) in HepG2 cells induced by T cell–CM or TAM-CM (n = 4 for C and n = 8 for D). Scale bar: 20 μm. (E) Expression of CD274 on Hepa1-6 cells cultured in vitro or inoculated in liver of immune-competent mice (n = 8). (F and G) P65 knockdown (shRELA) or IFN-γ receptor knockdown (shIFNGR1) Hepa1-6 cells, as well as the control Hepa1–6 cells, were inoculated in liver of C57BL/6 mice as described (Supplemental Figure 2E). CD274 expression in tumor tissues (F) and tumor volume (G) were analyzed. (H and I) Mice bearing Hepa1-6 hepatoma were injected with isotype Ab, anti-CD3 Ab, or anti-CSF1R Ab as described (Supplemental Figure 2F). CD274 expression in tumor tissues (H) and tumor volume (I) were analyzed. Data represent mean ± SEM. Results are representative of at least 3 separate experiments (n = 7). **P < 0.01; ***P < 0.001, 1-way ANOVA with Bonferroni’s post test (B and D), Dunett’s post test (FI), or Student’s t test (E).
Figure 5
Figure 5. Macrophages and T cells induce PD-L1+ cancer cells with distinct cancer hallmarks.
(AE) PD-L1+ HepG2 cells were generated by transducing with pBABE-Puro retroviral vector encoding human CD274 or incubating with T cell–CM or TAM-CM. Proteins of survival genes in serum-starvation cells (A), apoptosis of serum-starvation cells (B), migration of cells (C), proteins of EMT genes in cells (D), and expression of EMT markers (E) after 24 hours were determined. Data are representative of 4 separate experiments (n = 4 for A and D, n = 8 for B and E, and n = 7 for C). Scale bars: 500 μm (C); 20 μm (D). (F) Fold changes of protumorigenic gene mRNA levels in TAM-CM–generated PD-L1+ HepG2 cells compared with untreated HepG2 cells were analyzed by SuperArray Real-Time PCR. (G) GSEA of angiogenesis signature, metastasis signature, and EMT-like signature in CD68/CD3Ehi HCC samples versus CD68/CD3Elo counterparts within CD274hi HCC patients from TCGA data set. (H) Different levels of angiogenesis progression in CD68/CD3hi HCC samples versus CD68/CD3lo counterparts within CD274hi HCC patients (n = 139). Scale bar: 100 μm. Data represent mean ± SEM. **P < 0.01; ***P < 0.001, 1-way ANOVA with Dunett’s post test (B, C, and E) or χ2 test (H).
Figure 6
Figure 6. Macrophages generate aggressive PD-L1+ cancer cells via NF-κB signaling.
(A and B) Incubating with an inhibitor against NF-κB and knockdown of P65 NF-κB subunit (siRELA) attenuated migration (A) and EMT marker expressions of TAM-CM–generated PD-L1+ HepG2 cells (B) (n = 7 for A and n = 5 for B). (CG) HepG2 cells were left untreated or were incubated with TNF-α plus IL-1β or IFN-γ. Activation of indicated pathways (C), P65 nuclear translocation (D), migration of cells (E and F), and EMT marker expressions (G) were analyzed (n = 5). Scale bars: 500 μm (A and E); 20 μm (D). Data represent mean ± SEM. Results are representative of 4 separate experiments. **P < 0.01; ***P < 0.001, 1-way ANOVA with Bonferroni’s post test (A and B) or Dunett’s post test (F and G).
Figure 7
Figure 7. PD-L1+ tumors generated differently respond to therapeutic strategies distinctly.
(A) PD-L1+ HepG2 cells were generated by transducing with pBABE-Puro retroviral vector encoding human CD274 or incubating with tumor T cell–CM or TAM-CM. Survival of cells after 48-hour exposure to doxorubicin was determined (n = 4). (B and C) Incubating with an inhibitor against NF-κB (B) and knockdown of P65 NF-κB subunit (siRELA, C) in HepG2 cells attenuated TAM-CM–mediated resistance to doxorubicin (0.25 μg/mL; n = 7 for B and n = 6 for C). (DG) PD-L1+ hepatoma Hepa1-6 cells were generated by transducing with pBABE-Puro retroviral vector encoding mouse CD274 or by exposure to CM from Hepa1-6 hepatoma–derived macrophages or T cells (D). Thereafter, these cells were left untreated or cultured with Hepa1-6 hepatoma–derived CD8+ T cells in the presence of control IgG or an Ab against PD-L1. Survival of Hepa1-6 cells at indicated times (E), 24-hour production of IFN-γ and IL-2 by T cells (F), and 24-hour expression or CD107a on T cells (G) were determined. Data represent mean ± SEM. Results are representative of at least 4 separate experiments. *P < 0.05; **P < 0.01; ***P < 0.001, 1-way ANOVA with Dunett’s post test (A, F, and G), Student’s t test (B and C), or 2-way ANOVA with Bonferroni’s post test (E).
Figure 8
Figure 8. Suppressing macrophage-elicited NF-κB activation augments immunotherapeutic efficacy of a PD-L1 Ab.
(A and B) Mice bearing Hepa1-6 hepatoma in dorsal tissues for 15 days were left untreated or were treated with isotype, αCSF1R Ab, αPD-L1 Ab, or αCSF1R Ab plus αPD-L1 Ab as described (A). Tumor sizes over the indicated time were analyzed (B, n = 8). (C and D) WT (untreated or shNC) or P65 knockdown (shRELA) Hepa1-6 cells were inoculated in dorsal tissues of C57BL/6 mice. Thereafter, mice bearing P65 knockdown (shRELA) Hepa1-6 hepatoma were untreated or treated with isotype or αPD-L1 Ab (C). Tumor sizes over the indicated time were analyzed (D, n = 8). (E) Correlation between CD68 expression and the scoring of the NF-κB pathway were calculated in HCC, STAD, COAD, and LUAD patients from the TCGA data set. (F) Statistical analysis was conducted based on the scoring of the NF-κB pathway and recurrence rate in HCC, STAD, COAD, and LUAD patients from the TCGA data set. P values and R values were calculated based on the analysis of Pearson’s correlation. Data represent mean ± SEM. Results are representative of 3 separate experiments. ***P < 0.001, 1-way ANOVA with Bonferroni’s post test (B and D) or χ2 test (F).

References

    1. Sharma P, Allison JP. The future of immune checkpoint therapy. Science. 2015;348(6230):56–61. doi: 10.1126/science.aaa8172. - DOI - PubMed
    1. Zou W, Wolchok JD, Chen L. PD-L1 (B7-H1) and PD-1 pathway blockade for cancer therapy: Mechanisms, response biomarkers, and combinations. Sci Transl Med. 2016;8(328):328rv4. doi: 10.1126/scitranslmed.aad7118. - DOI - PMC - PubMed
    1. Keir ME, Francisco LM, Sharpe AH. PD-1 and its ligands in T-cell immunity. Curr Opin Immunol. 2007;19(3):309–314. doi: 10.1016/j.coi.2007.04.012. - DOI - PubMed
    1. Xiao X, et al. PD-1hi identifies a novel regulatory B-cell population in human hepatoma that promotes disease progression. Cancer Discov. 2016;6(5):546–559. doi: 10.1158/2159-8290.CD-15-1408. - DOI - PubMed
    1. Devulder J, Tsicopoulos A, Duez C. Neuroendocrine control of natural killer cell function through the checkpoint molecule PD-1. Cell Mol Immunol. 2019;16(2):109–111. doi: 10.1038/s41423-018-0180-2. - DOI - PMC - PubMed

Publication types

MeSH terms