. 2019 May 21;14(5):e0217276.
doi: 10.1371/journal.pone.0217276. eCollection 2019.

Inhibition of immune checkpoints PD-1, CTLA-4, and IDO1 coordinately induces immune-mediated liver injury in mice

Affiliations

Inhibition of immune checkpoints PD-1, CTLA-4, and IDO1 coordinately induces immune-mediated liver injury in mice

Timothy Affolter et al. PLoS One. .

Abstract

Cancer cells harness immune checkpoints such as cytotoxic T-lymphocyte-associated protein 4 (CTLA-4), programmed cell death protein 1 (PD-1) and indoleamine 2,3-dioxygenase 1 (IDO1) to evade immune control. Checkpoint inhibitors have demonstrated durable anti-tumor efficacy in human and preclinical models. Liver toxicity is one of the common immune-related adverse events associated with checkpoint inhibitors (CPIs) and its frequency and severity often increase significantly during CPI combination therapies. We aim to develop a mouse model to elucidate the immune mechanisms of CPI-associated liver toxicity. Co-administration of CTLA-4 blocking antibody, 9D9, and/or an IDO1 inhibitor, epacadostat in wild-type and PD-1-/- mice (to simulate the effect of PD1 blockade) synergistically induced liver injury and immune cell infiltration. Infiltrated cells were primarily composed of CD8+ T cells and positively associated with hepatocyte necrosis. Strikingly, sites of hepatocyte necrosis were frequently surrounded by clusters of mononuclear immune cells. CPI treatments resulted in increased expression of genes associated with hepatocyte cell death, leukocyte migration and T cell activation in the liver. In conclusion, blockade of immune checkpoints PD-1, CTLA-4, and IDO1 act synergistically to enhance T cell infiltration and activity in the liver, leading to hepatocyte death.


Conflict of interest statement

Authors TA, HL, DB, QZ, SX, VT and CJ are employed by Pfizer Inc. This does not alter our adherence to PLOS ONE policies on sharing data and materials.

Figures
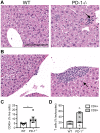
Fig 1
Fig 1. PD-1-/- mice have increased T cell liver inflammation.
Representative H&E images of C57BL/6N (WT) and PD-1-/- liver in the centrilobular (A) and periportal (B) regions. Quantification of liver (C) CD45+ cells and (D) T cells subsets by flow cytometry. Arrows indicate regions of immune cell accumulation. Scale bar = 150 μm. All data are reported as mean ± SEM. *P<0.05, aP < 0.05 CD4 WT vs PD-1-/-, bP < 0.0001 CD8 WT vs PD-1-/-, cP < 0.0001 total T cells WT vs PD-1-/-, unpaired t test, n = 5 (WT) and 6 (PD-1-/-).
Fig 2
Fig 2. Epacadostat pharmacology.
Pharmacokinetics (PK)/pharmacodynamics (PD) in (A) wild-type and (B) PD-1-/- mice. Mice were administered epacadostat at doses of 100, 300, and 600 mg/kg/dose by oral gavage at t = 0 h and t = 6 h, and total plasma concentrations of epacadostat and kynurenine were measured by LC-MS/MS. Epacadostat concentrations were below the limit of quantification at 24 h for the 100 mg/kg BID dose. All values are reported as mean ± SD. n = 3 (WT) and 3 (PD-1-/-). PD: pharmacodynamics, PK: pharmacokinetics, BID: bis in die (twice daily).
Fig 3
Fig 3. Blockade of IDO1 and CTLA-4 pathways induces liver injury in WT mice.
Mice were treated with 300 mg/kg BID epacadostat and/or 9D9 for 4 weeks (see methods). (A) Representative H&E images and quantification of liver (B) single cell necrosis and (C) periportal infiltration. (D) GLDH. (E) Quantification of T cells by flow cytometry. Necrosis, infiltration and GLDH data were analyzed with a Kruskal-Wallis test and Dunn’s multiple comparisons test. Flow cytometry data was analyzed with an ordinary one-way ANOVA with Tukey’s multiple comparisons test. Arrows indicate immune cell accumulation. Arrowheads indicate a necrotic cell. Scale bar = 150 μm. All data are reported as mean ± SEM *P<0.05, ***P<0.001, n = 6 per group. GLDH: glutamate dehydrogenase.
Fig 4
Fig 4. IDO1 and CTLA-4 blockade induces liver injury in PD-1-/- mice.
PD-1-/- mice were treated with 9D9, epacadostat (A, C panels are 300 mg/kg BID only, B includes 300 and 600 mg/kg BID), or in combination for 2 or 6 weeks. (A) Representative H&E images and (B) quantification of single cell necrosis. (C) GLDH levels through 6 weeks. Arrows indicate immune cell accumulation. Arrowheads indicate a necrotic cell. Scale bar = 150 μm. All data (n = 6 per group) are reported as mean ± SEM. Necrosis data was analyzed with a Kruskal-Wallis test and Dunn’s multiple comparisons test. GLDH data was analyzed with a repeated measures two-way ANOVA and Tukey’s multiple comparisons test. aP < 0.05 9D9 + epacadostat vs vehicle, 9D9, bP < 0.05 9D9 + epacadostat vs epacadostat, cP < 0.05 epacadostat vs vehicle, 9D9.
Fig 5
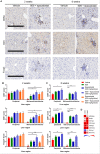
Fig 5. Checkpoint blockade in PD-1-/- mice increases liver parenchymal T cell inflammation.
PD-1-/- mice were treated with 9D9, lower dose (300 mg/kg BID) epacadostat or in combination for 2 or 6 weeks. (A) Representative images of the mid-zonal/centrilobular region of the liver in the vehicle and combination groups. Semi-quantitative analysis of immunohistochemical detection of CD4, CD8α or Foxp3 at (B) 2 and (C) 6 weeks of treatment. (D) Statistical measure of the strength of association (gamma value) between liver hepatocyte necrosis score with GLDH, immune infiltrates, and immunohistochemistry scores. All data (n = 6 per group) are reported as mean ± SEM. Immune cell scores were analyzed with a Kruskal-Wallis test and Dunn’s multiple comparisons test. Scale bar = 300 μm. *P<0.05, **P<0.01, ***P<0.0001. p: periportal, mc: mid-zonal/centrilobular.
Fig 6
Fig 6. Checkpoint inhibitors increase the number of T cells in the liver of PD-1-/- mice.
Mice were treated with anti-mouse CTLA-4 (9D9), lower dose (300 mg/kg BID) epacadostat or in combination for 6 weeks (A–H) or 3 weeks (I). Single cell suspensions of the whole liver were analyzed for (A) CD45+ cells, (B) CD11b+F4/80+ macrophages, (C) Gr1+CD11b+ myeloid derived suppressor cells (MDSC)s, (D) CD49b+ natural kill (NK) cells, (E) CD3+ T cells, (F) CD3+CD8+ T cells (G) CD3+CD4+ T cells, (H) Foxp3+CD4+ T cells, and (I) Ki67+ T cell subsets by flow cytometry. All data are reported as mean ± SEM. *P<0.05, **P<0.01, ***P<0.001, ****P<0.0001, n = 6 per group, one-way ANOVA with Tukey’s multiple comparisons test (A–H) or n = 12 per group, unpaired t-test (I).
Fig 7
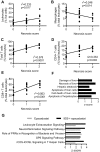
Fig 7. T cell infiltration of the liver positively associates with necrosis.
Mice were treated with anti-mouse CTLA-4 (9D9), 300 mg/kg BID epacadostat or in combination for 6 weeks (A-E) or with 600 mg/kg BID epacadostat or in combination for 2 weeks (F-G). Linear regression analysis of (A) leukocytes (CD45+ cells), (B) macrophages, (C) total T cells and (D) CD4+ and (E) CD8+ T cells as defined in Fig 6 with single cell necrosis. (F) The top activated (> 1.5 z-score) toxicity pathways significantly modulated by 9D9 + epacadostat treatment compared with vehicle control, sorted by p-value and (G) the top five significantly regulated canonical pathways relative to vehicle identified by ingenuity pathway analysis (sorted by combination vs vehicle ascending p-values). There were no significant changes, and thus no activation of these canonical pathways, in the 9D9 vs vehicle group. PRR: pattern recognition receptor, ICOS: inducible T-cell costimulator ICOSL: inducible T-cell costimulatory ligand.

References

    1. Prendergast GC, Malachowski WP, DuHadaway JB, Muller AJ. Discovery of IDO1 Inhibitors: From bench to bedside. Cancer Res. 2017;77(24):6795–811. 10.1158/0008-5472.CAN-17-2285 . - DOI - PMC - PubMed
    1. Larkin J, Chiarion-Sileni V, Gonzalez R, Grob JJ, Cowey CL, Lao CD, et al. Combined Nivolumab and Ipilimumab or Monotherapy in Untreated Melanoma. N Engl J Med. 2015;373(1):23–34. Epub 2015/06/02. 10.1056/NEJMoa1504030 . - DOI - PMC - PubMed
    1. Le DT, Durham JN, Smith KN, Wang H, Bartlett BR, Aulakh LK, et al. Mismatch repair deficiency predicts response of solid tumors to PD-1 blockade. Science. 2017;357(6349):409–13. Epub 2017/06/10. 10.1126/science.aan6733 . - DOI - PMC - PubMed
    1. Bellmunt J, de Wit R, Vaughn DJ, Fradet Y, Lee JL, Fong L, et al. Pembrolizumab as Second-Line Therapy for Advanced Urothelial Carcinoma. N Engl J Med. 2017;376(11):1015–26. Epub 2017/02/18. 10.1056/NEJMoa1613683 . - DOI - PMC - PubMed
    1. El-Khoueiry AB, Sangro B, Yau T, Crocenzi TS, Kudo M, Hsu C, et al. Nivolumab in patients with advanced hepatocellular carcinoma (CheckMate 040): an open-label, non-comparative, phase 1/2 dose escalation and expansion trial. Lancet. 2017;389(10088):2492–502. Epub 2017/04/25. 10.1016/S0140-6736(17)31046-2 . - DOI - PMC - PubMed

Publication types

MeSH terms