Meta-Analysis
. 2020 Jan 4;46(1):43-53.
doi: 10.1093/schbul/sbz029.

A Meta-analysis of Retinal Cytoarchitectural Abnormalities in Schizophrenia and Bipolar Disorder

Affiliations
Meta-Analysis

A Meta-analysis of Retinal Cytoarchitectural Abnormalities in Schizophrenia and Bipolar Disorder

Paulo Lizano et al. Schizophr Bull. .

Abstract

Background: Schizophrenia (SZ) and bipolar disorder (BD) are characterized by reductions in gray matter and white matter. Limitations in brain imaging have led researchers to use optical coherence tomography (OCT) to explore retinal imaging biomarkers of brain pathology. We examine the retinal layers that may be associated with SZ or BD.

Methods: Articles identified using PubMed, Web of Science, Cochrane Database. Twelve studies met inclusion for acutely/chronically ill patients. We used fixed or random effects meta-analysis for probands (SZ and BD), SZ or BD eyes vs healthy control (HC) eyes. We adjusted for sources of bias, cross-validated results, and report standardized mean differences (SMD). Statistical analysis performed using meta package in R.

Results: Data from 820 proband eyes (SZ = 541, BD = 279) and 904 HC eyes were suitable for meta-analysis. The peripapillary retinal nerve fiber layer (RNFL) showed significant thinning in SZ and BD eyes compared to HC eyes (n = 12, SMD = -0.74, -0.51, -1.06, respectively). RNFL thinning was greatest in the nasal, temporal, and superior regions. The combined peripapillary ganglion cell layer and inner plexiform layer (GCL-IPL) showed significant thinning in SZ and BD eyes compared to HC eyes (n = 4, SMD = -0.39, -0.44, -0.28, respectively). No statistically significant differences were identified in other retinal or choroidal regions. Clinical variables were unrelated to the RNFL or GCL-IPL thickness by meta-regression.

Conclusion: The observed retinal layer thinning is consistent with the classic gray- and white-matter atrophy observed on neuroimaging in SZ and BD patients. OCT may be a useful biomarker tool in studying the neurobiology of psychosis.

Keywords: bipolar disorder; choroid thickness; ganglion cell layer; macula volume; optical coherence tomography; retinal nerve fiber layer thickness; schizophrenia.


Figures

Fig. 1.
Fig. 1.
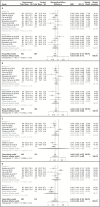
Meta-analysis of peripapillary RNFL OCT data. Inverse variance with fixed and random effects for RNFL data from SZ eyes (group 1), BD (group 2), or probands compared with HC eyes. Number in the total row includes eyes for which a mean difference could be calculated. Horizontal bars indicate 95% CI. RFNL, retinal nerve fiber layer; SMD, standardized mean difference; OCT, optical coherence tomography; SZ, schizophrenia; BD, bipolar disorder; HC, healthy control.
Fig. 2.
Fig. 2.
Meta-analysis of nasal, temporal, superior, and inferior RNFL OCT data. Inverse variance with fixed and random effects for (A) nasal, (B) temporal, (C) superior, and (D) inferior RNFL data from SZ eyes (group 1), BD (group 2) or probands compared with HC eyes. Number in the total row includes eyes for which a mean difference could be calculated. Horizontal bars indicate 95% CI. RFNL, retinal nerve fiber layer; SD, standard deviation, SMD, standardized mean difference; OCT, optical coherence tomography; SZ, schizophrenia; BD, bipolar disorder; HC, healthy control.
Fig. 3.
Fig. 3.
Meta-analysis of peripapillary GCL-IPL, GCC, GCL OCT data. Inverse variance with fixed and random effects for (A) GCL-IPL, (B) GCC, and (C) GCL data from SZ eyes (group 1), BD (group 2) or probands (when available) compared with HC eyes. Number in the total row includes eyes for which a mean difference could be calculated. Horizontal bars indicate 95% CI. GCL, ganglion cell layer; IPL, inner plexiform layer; GCC; ganglion cell complex; SMD, standardized mean difference; OCT, optical coherence tomography; SZ, schizophrenia; BD, bipolar disorder; HC, healthy control.
Fig. 4.
Fig. 4.
Mean effect size comparisons of OCT layer segmentations. Circles indicate SMD (Cohen’s d) effect size and horizontal bars indicate 95% CI. Groups are shown in green (BD), blue (SZ), and yellow (probands) compare to HC eyes. SMD, standardized mean difference; OCT, optical coherence tomography; SZ, schizophrenia; BD, bipolar disorder; HC, healthy control; RNFL, retinal nerve fiber layer; GCIPL, ganglion cell layer; IPL, inner plexiform layer; CT, choroidal thickness.

References

    1. Insel TR. Rethinking schizophrenia. Nature. 2010;468(7321):187–193. doi:10.1038/nature09552 - DOI - PubMed
    1. Whiteford HA, Ferrari AJ, Degenhardt L, Feigin V, Vos T. The global burden of mental, neurological and substance use disorders: an analysis from the Global Burden of Disease Study 2010. Forloni G, ed. PLoS One. 2015;10(2):e0116820. doi:10.1371/journal.pone.0116820 - DOI - PMC - PubMed
    1. Merikangas KR, Akiskal HS, Angst J, et al. . Lifetime and 12-month prevalence of bipolar spectrum disorder in the National Comorbidity Survey replication. Arch Gen Psychiatry. 2007;64(5):543–552. doi:10.1001/archpsyc.64.5.543 - DOI - PMC - PubMed
    1. Tamminga CA, Ivleva EI, Keshavan MS, et al. . Clinical phenotypes of psychosis in the Bipolar-Schizophrenia Network on Intermediate Phenotypes (B-SNIP). Am J Psychiatry. 2013;170(11):1263–1274. - PubMed
    1. Honea R, Crow TJ, Passingham D, Mackay CE. Regional deficits in brain volume in schizophrenia: a meta-analysis of voxel-based morphometry studies. Am J Psychiatry. 2005;162(12):2233–2245. doi:10.1176/appi.ajp.162.12.2233 - DOI - PubMed

Publication types