. 2019 May 20;49(4):632-642.e7.
doi: 10.1016/j.devcel.2019.04.032.

The Long Noncoding RNA Pnky Is a Trans-acting Regulator of Cortical Development In Vivo

Affiliations

The Long Noncoding RNA Pnky Is a Trans-acting Regulator of Cortical Development In Vivo

Rebecca E Andersen et al. Dev Cell. .

Abstract

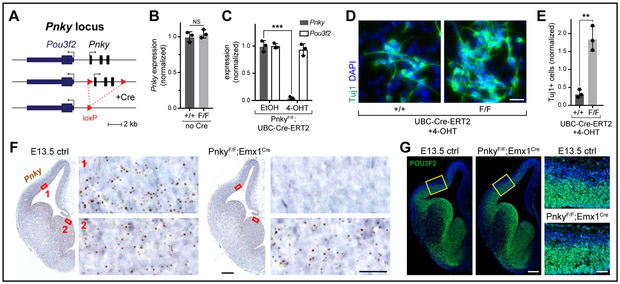
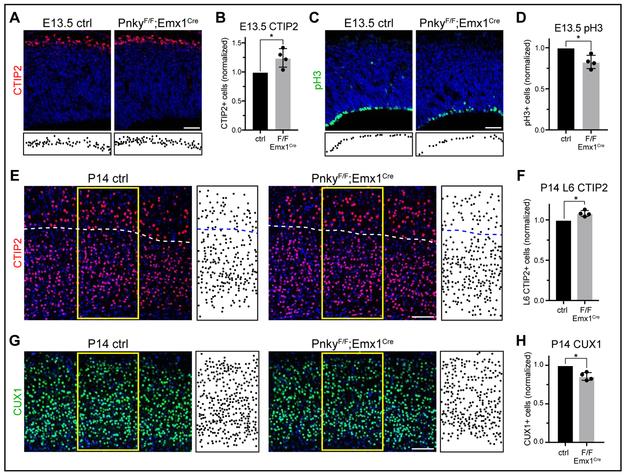
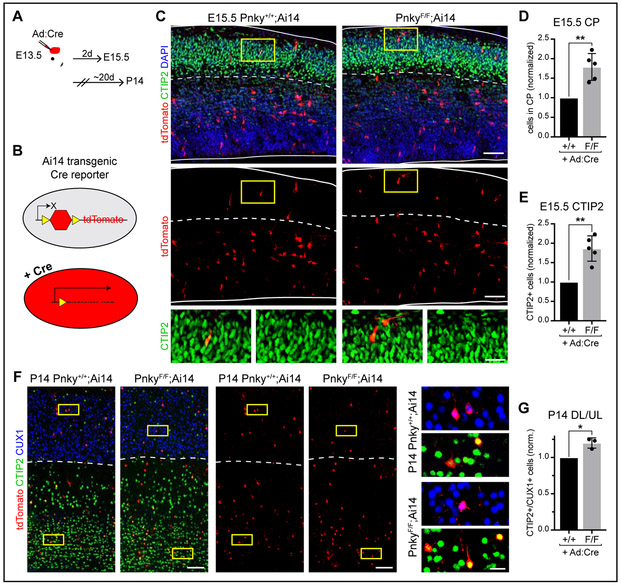
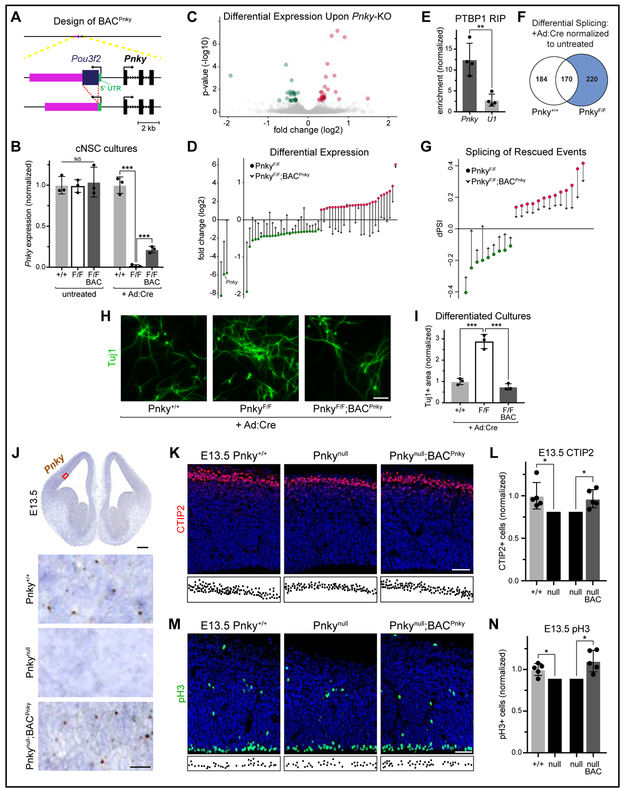
While it is now appreciated that certain long noncoding RNAs (lncRNAs) have important functions in cell biology, relatively few have been shown to regulate development in vivo, particularly with genetic strategies that establish cis versus trans mechanisms. Pnky is a nuclear-enriched lncRNA that is transcribed divergently from the neighboring proneural transcription factor Pou3f2. Here, we show that conditional deletion of Pnky from the developing cortex regulates the production of projection neurons from neural stem cells (NSCs) in a cell-autonomous manner, altering postnatal cortical lamination. Surprisingly, Pou3f2 expression is not disrupted by deletion of the entire Pnky gene. Moreover, expression of Pnky from a BAC transgene rescues the differential gene expression and increased neurogenesis of Pnky-knockout NSCs, as well as the developmental phenotypes of Pnky-deletion in vivo. Thus, despite being transcribed divergently from a key developmental transcription factor, the lncRNA Pnky regulates development in trans.

Keywords: BAC transgenic rescue; NSCs; lncRNA; lncRNA knockout mouse; long noncoding RNA; neural stem cells; neurodevelopment; trans-acting lncRNA.


Conflict of interest statement

DECLARATION OF INTERESTS

The authors declare no competing interests.

Figures

Figure 1:
Figure 1:. Generation of a conditional deletion allele for the lncRNA Pnky
Quantifications: mean +/− SD. NS = not significant, ** = p < 0.01, *** = p < 0.001, unpaired two-tailed t test. A, Schematic of Pnky locus and loxP site insertions. B, Pnky levels in V-SVZ cultures by qRT-PCR. Biological replicate littermates, normalized to Pnky+/+ mean. C, Pnky and Pou3f2 in ethanol (EtOH)- or 4-OHT-treated V-SVZ cultures by qRT-PCR. Technical replicates, normalized to EtOH-treated mean. D, Tuj1 ICC in d4 differentiated V-SVZ cultures. Scale bar = 25μm. E, Quantification of (D). Technical replicates with independent EtOH or 4-OHT treatment, normalized to EtOH-treated cultures for each genotype. F, ISH of Pnky (brown puncta) in coronal brain sections, with hematoxylin nuclear counterstain (blue). Red boxes = regions of pallium (1) and subpallium (2) enlarged in adjacent panels. Scale bars = 250μm (hemispheres) and 25μm (insets). G, POU3F2 IHC with DAPI nuclear stain (blue). Yellow boxes = regions of pallium enlarged in adjacent panels. Scale bars = 200μm (hemispheres) and 50μm (insets). See also Figure S1.
Figure 2:
Figure 2:. Pnky regulates cortical neurogenesis in vivo
Quantifications: mean +/− SD of biological replicates, normalized to littermate controls. * = p < 0.05, two-tailed ratio paired t test. A, CTIP2 IHC with DAPI (blue). Locations of CTIP2+ cells in CP depicted below. Scale bar = 50μm. B, Quantification of (A). C, pH3 IHC with DAPI (blue). Locations of pH3+ cells in VZ depicted below. Scale bar = 50μm. D, Quantification of (C). E, CTIP2 IHC in the deep layers of P14 cortex, with DAPI (blue). Dotted line = border between L5 and L6. Locations of CTIP2+ cells within yellow boxes depicted to the right. Scale bar = 100μm. F, Quantification of (E). G, CUX1 IHC in the upper layers of P14 cortex, with DAPI (blue). Locations of CUX1+ cells within yellow boxes depicted to the right. Scale bar = 100μm. H, Quantification of (G). See also Figure S2.
Figure 3:
Figure 3:. Pnky functions cell-autonomously in the developing cortex
Quantifications: mean +/− SD of biological replicates, normalized to littermate controls. * = p < 0.05, ** = p < 0.01, two-tailed ratio paired t test. A, Schematic of in utero Ad:Cre viral injections. B, Schematic of Ai14 transgenic Cre reporter. C, IHC of tdTomato and CTIP2 at E15.5. Arrowheads = double-positive cells within CP, demarcated by dotted line. Yellow boxes = regions enlarged below. Scale bars = 50μm and 20μm (insets). D, Quantification of proportion of tdTomato+ cells in the CP. E, Quantification of proportion of tdTomato+ cells located in CP and CTIP2+ (D). F, IHC for tdTomato, CTIP2, and CUX1 at P14. Dotted line = border between deep and upper cortical layers. Yellow boxes = regions enlarged in adjacent panels. Arrowheads = double-positive cells. Scale bars = 100μm and 20μm (insets). G, Quantification of ratio of CTIP2+ deep layer cells to CUX1+ upper layer cells within tdTomato+ population at P14. See also Figure S3.
Figure 4:
Figure 4:. BAC transgenic expression of Pnky rescues loss of the endogenous lncRNA
Quantifications: mean +/− SD of separate biological replicates, except as indicated in (I). NS = not significant, * = p < 0.05, *** = p < .001. A, Schematic of BACPnky transgene. B, Pnky expression in untreated or +Ad:Cre cNSC cultures by RNA-seq. Normalized to Pnky+/+ mean for each treatment group. C, Volcano plot of differentially-expressed genes upon Pnky-cKO. Three genes with fold changes outside this range are not displayed here (see D). D, Log2 fold changes of all significantly differentially-expressed genes in PnkyF/F +Ad:Cre cultures (circles). Arrowheads = log2 fold changes for these genes in PnkyF/F;BACPnky +Ad:Cre cultures. E, Enrichment following RIP with PTBP1 antibodies from cNSC cultures. 4 technical replicates from 2 separate experiments, normalized to levels of β-actin. F, Alternatively-spliced events in cNSCs upon Ad:Cre treatment. Significant events in PnkyF/F +Ad:Cre samples that did not overlap with events in Pnky+/+ +Ad:Cre samples were analyzed further. G, Log2 fold changes of rescued alternatively-spliced events. H, Tuj1 ICC in d7 differentiated cNSC cultures. Scale bar = 50μm. I, Quantification of Tuj1+ area from (H). Mean +/− SD from technical triplicates comprised of cells pooled from three biological replicates. Normalized to uninfected controls and to Pnky+/+ +Ad:Cre values. Statistical analysis = one-way ANOVA with Turkey’s multiple comparisons test. J, ISH of Pnky (brown puncta) with hematoxylin counterstain (blue). Representative section with red box indicating approximate region of pallium enlarged below. Scale bars = 250μm and 25μm (insets). K, CTIP2 IHC with DAPI (blue). Locations of CTIP2+ cells in CP depicted below. Scale bar = 50μm. L, Quantification of (K), two-tailed ratio paired t test. M, pH3 IHC with DAPI (blue). Locations of pH3+ cells in VZ depicted below. Scale bar = 50μm. N, Quantification of (M), two-tailed ratio paired t test. See also Figure S4 and Table S2.

References

    1. Anderson KM, Anderson DM, McAnally JR, Shelton JM, Bassel-Duby R, and Olson EN (2016). Transcription of the non-coding RNA upperhand controls Hand2 expression and heart development. Nature 539, 433–436. - PMC - PubMed
    1. Aprea J, Prenninger S, Dori M, Ghosh T, Monasor LS, Wessendorf E, Zocher S, Massalini S, Alexopoulou D, Lesche M, et al. (2013). Transcriptome sequencing during mouse brain development identifies long non-coding RNAs functionally involved in neurogenic commitment. EMBO J. 32, 3145–3160. - PMC - PubMed
    1. Arnold SJ, Huang G-J, Cheung AFP, Era T, Nishikawa S-I, Bikoff EK, Molnár Z, Robertson EJ, and Groszer M (2008). The T-box transcription factor Eomes/Tbr2 regulates neurogenesis in the cortical subventricular zone. Genes Dev. 22, 2479–2484. - PMC - PubMed
    1. Barry G, Briggs JA, Vanichkina DP, Poth EM, Beveridge NJ, Ratnu VS, Nayler SP, Nones K, Hu J, Bredy TW, et al. (2014). The long non-coding RNA Gomafu is acutely regulated in response to neuronal activation and involved in schizophrenia-associated alternative splicing. Mol. Psychiatry 19, 486–494. - PubMed
    1. Bassett AR, Akhtar A, Barlow DP, Bird AP, Brockdorff N, Duboule D, Ephrussi A, Ferguson-Smith AC, Gingeras TR, Haerty W, et al. (2014). Considerations when investigating lncRNA function in vivo. Elife 3, e03058. - PMC - PubMed

Publication types