

Elevated oxysterol levels in human and mouse livers reflect nonalcoholic steatohepatitis
- PMID: 31113816
- PMCID: PMC6602130
- DOI: 10.1194/jlr.M093229
Elevated oxysterol levels in human and mouse livers reflect nonalcoholic steatohepatitis
Abstract
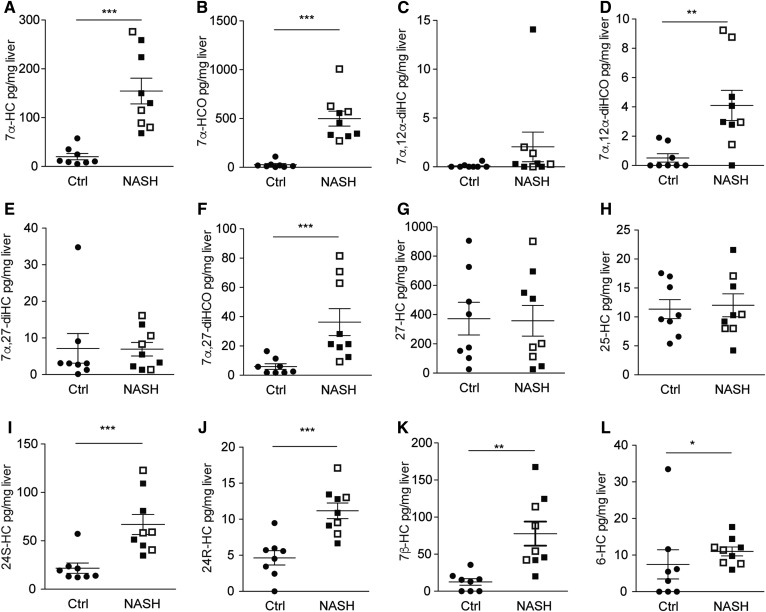
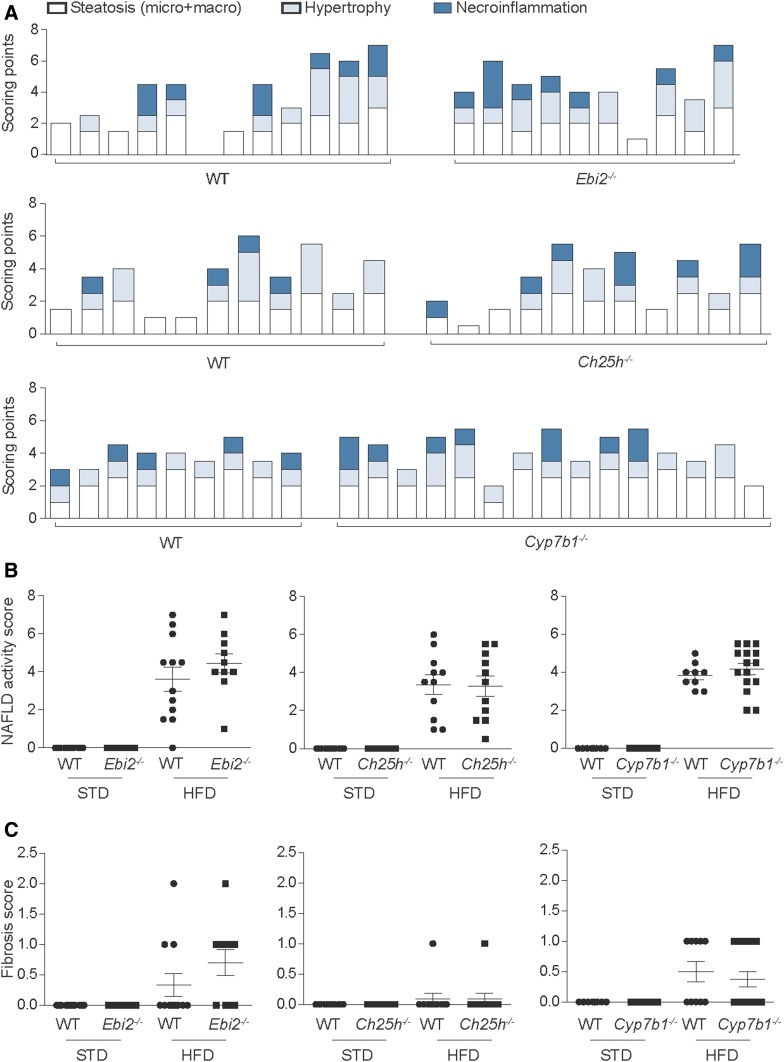
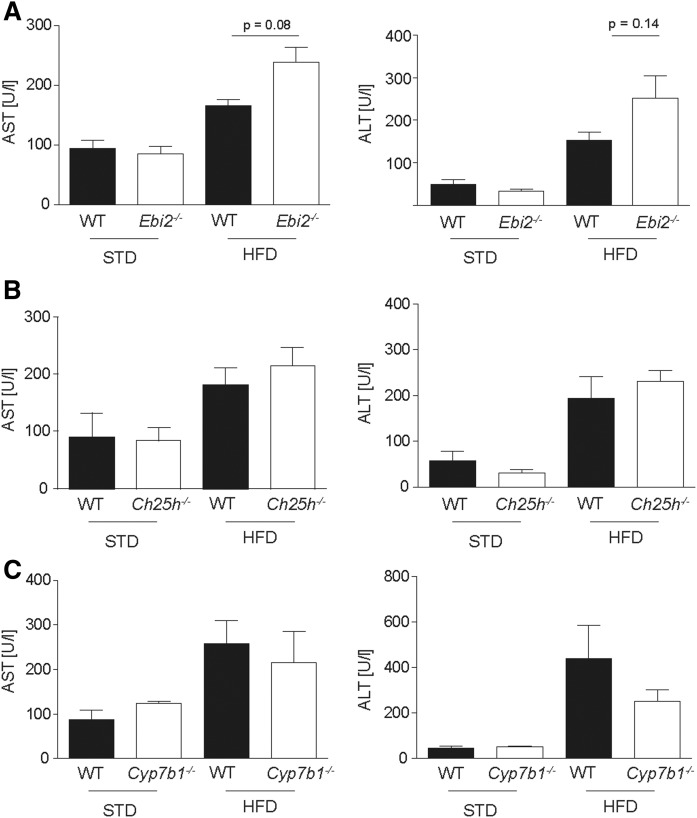
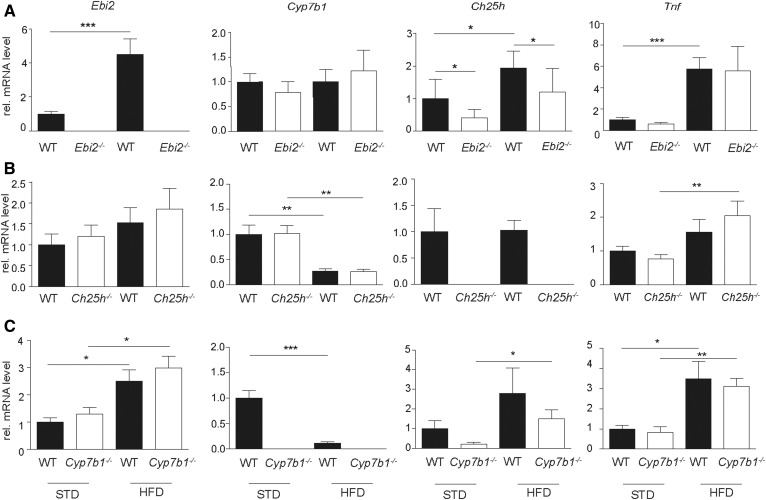
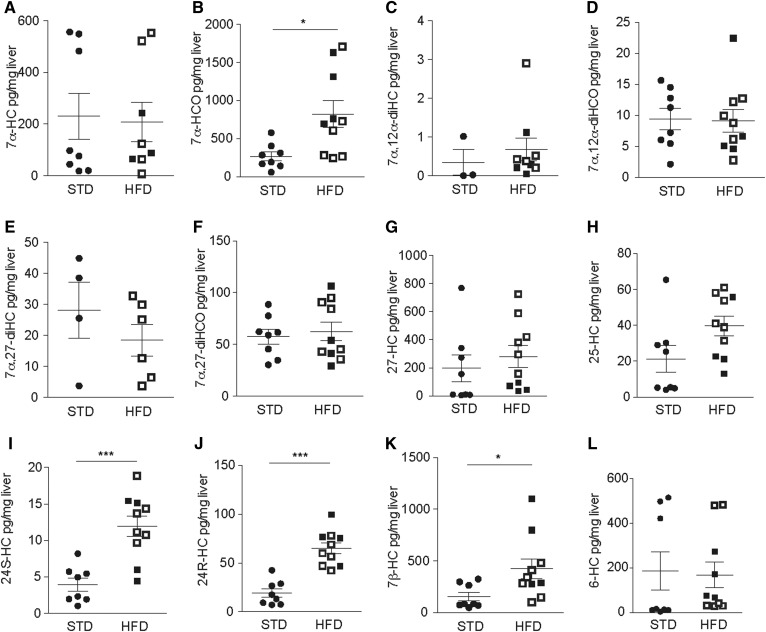
Nonalcoholic steatohepatitis (NASH), a primary cause of liver disease, leads to complications such as fibrosis, cirrhosis, and carcinoma, but the pathophysiology of NASH is incompletely understood. Epstein-Barr virus-induced G protein-coupled receptor 2 (EBI2) and its oxysterol ligand 7α,25-dihydroxycholesterol (7α,25-diHC) are recently discovered immune regulators. Several lines of evidence suggest a role of oxysterols in NASH pathogenesis, but rigorous testing has not been performed. We measured oxysterol levels in the livers of NASH patients by LC-MS and tested the role of the EBI2-7α,25-diHC system in a murine feeding model of NASH. Free oxysterol profiling in livers from NASH patients revealed a pronounced increase in 24- and 7-hydroxylated oxysterols in NASH compared with controls. Levels of 24- and 7-hydroxylated oxysterols correlated with histological NASH activity. Histological analysis of murine liver samples demonstrated ballooning and liver inflammation. No significant genotype-related differences were observed in Ebi2-/- mice and mice with defects in the 7α,25-diHC synthesizing enzymes CH25H and CYP7B1 compared with wild-type littermate controls, arguing against an essential role of these genes in NASH pathogenesis. Elevated 24- and 7-hydroxylated oxysterol levels were confirmed in murine NASH liver samples. Our results suggest increased bile acid synthesis in NASH samples, as judged by the enhanced level of 7α-hydroxycholest-4-en-3-one and impaired 24S-hydroxycholesterol metabolism as characteristic biochemical changes in livers affected by NASH.
Keywords: 25-hydroxycholesterol 7α-hydroxylase; Epstein-Barr virus-induced gene 2; cholesterol 25 hydroxylase; mouse feeding model; nonalcoholic fatty liver disease.
Copyright © 2019 Raselli et al.
Conflict of interest statement
G.R. was supported by grants from AbbVie, Ardeypharm, MSD, Falk, Flamentera, Novartis, Roche, Tillots, UCB, and Zeller. P.S. has received travel support from Falk, UCB, and Pfizer and an advisory board honorarium from Pfizer. B.M. has served on an advisory board for Gilead and Novigenix; has received traveling fees or speaking fees from Given Imaging, MSD, Vifor, and Novartis and has received an unrestricted research grant from MSD. A.G. serves as a steering committee member for Gilead, Intercept, and Novartis, advisor for AbbVie, Alexion, BMS, Gilead, Intercept, Ipsen, Novartis, Pfizer, and Sequana, speaker for AbbVie, Alexion, BMS, CSL Behring, Falk, Gilead, Intercept, Merz, Novartis, and Sequana, and has received research grants from Exalenz (Liver Investigation: Testing Marker Utility in Steatohepatitis; LITMUS), Intercept (Nonalcoholic Fatty Liver Disease Clinical Study Group; NAFLD CSG), Novartis, and Kibion.
Figures

References
-
- Ratziu V., Goodman Z., and Sanyal A.. 2015. Current efforts and trends in the treatment of NASH. J. Hepatol. 62: S65–S75. - PubMed
-
- Younossi Z. M., Stepanova M., Afendy M., Fang Y., Younossi Y., Mir H., and Srishord M.. 2011. Changes in the prevalence of the most common causes of chronic liver diseases in the United States from 1988 to 2008. Clin. Gastroenterol. Hepatol . 9: 524–530. - PubMed
-
- Lazo M., Hernaez R., Eberhardt M. S., Bonekamp S., Kamel I., Guallar E., Koteish A., Brancati F. L., and Clark J. M.. 2013. Prevalence of nonalcoholic fatty liver disease in the United States: the Third National Health and Nutrition Examination Survey, 1988–1994. Am. J. Epidemiol. 178: 38–45. - PMC - PubMed
-
- Williams C. D., Stengel J., Asike M. I., Torres D. M., Shaw J., Contreras M., Landt C. L., and Harrison S. A.. 2011. Prevalence of nonalcoholic fatty liver disease and nonalcoholic steatohepatitis among a largely middle-aged population utilizing ultrasound and liver biopsy: a prospective study. Gastroenterology. 140: 124–131. - PubMed
-
- Estes C., Anstee Q. M., Arias-Loste M. T., Bantel H., Bellentani S., Caballeria J., Colombo M., Craxi A., Crespo J., Day C. P., et al. . 2018. Modeling NAFLD disease burden in China, France, Germany, Italy, Japan, Spain, United Kingdom, and United States for the period 2016–2030. J. Hepatol. 69: 896–904. - PubMed
Publication types
MeSH terms
Substances
Grants and funding
LinkOut - more resources
Full Text Sources
Medical
Molecular Biology Databases
Research Materials
